--%>

Unitarily inelastic supply of labor

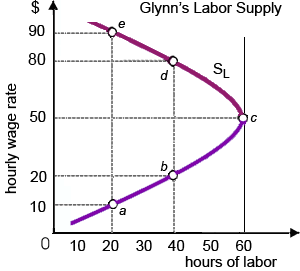
Glynn’s supply of labor is unitarily inelastic while the wage rate increases by: (1) $10 per hour to $20 per hour. (2) $10 per hour to $50 per hour. (3) $20 per hour to $50 per hour. (4) $20 per hour to $80 per hour. (5) $80 per hour to $90 per hour.

31_Labor-Leisure Trade-offs.png

How can I solve my Economics problem? Please suggest me the correct answer.

   Related Questions in Managerial Economics

  • Q : Substantial general training in firm A

    A firm which provides its workers along with substantial general training tends to: (1) retain such individuals by paying them the relatively highest wage premiums. (2) require workers to sign legal contracts of peonage and indenture. (3) increase wor

  • Q : Technological changes with machinery

    Technological changes which replace workers along with machinery are termed as: (1) homeostasis. (2) nanotechnology. (3) automation. (4) featherbedding. (5) solipsism. How can I solve my Economics problem? Please s

  • Q : Categorized the Positive income

    Categorized the Positive income Elasticity?

  • Q : Explain the term business cycle in brief

    Explain the term business cycle in brief.

  • Q : States the Wealth Definition in

    States the Wealth Definition in economics?

  • Q : Explain the decision making areas of

    Explain the decision making areas of the decision making.

  • Q : Substitution and Demands for Resources

    When the relative price of a resource decreases, we would usually expect a firm to employ less units of: (w) that resource due to the substitution effect. (x) that resource because of the output effect. (y) complementary resources due to the substitut

  • Q : Illustrate profit or loss on the cost

    A firm's total profit can be computed as all of the given except w) total revenue minus total cost. x) average profit per unit times quantity sold. y) (price minus average total cost) multiply with times quantity sold. z) marginal profit times quantity sold.

  • Q : Negative Relationship in Demand for

    The demand curve for labor can be demonstrated as a negative relationship between: (w) the quantity of labor demanded and the wage rate. (x) labor productivity and the quantity of labor used. (y) employment and output. (z) wages and GDP.

  • Q : Explain Exceptional Demand Curve

    Explain Exceptional Demand Curve.