--%>

Unitarily elasticity in supply curve

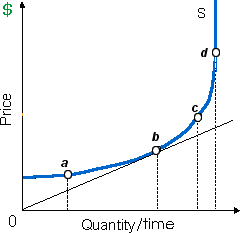
At point b, in demonstrated figure the supply curve into this graph is: (w) perfectly elastic. (x) elastic, but not perfectly that why. (y) unitarily elastic. (z) inelastic.

327_Price Elasticity of Supply3.png

Can anybody suggest me the proper explanation for given problem regarding Economics generally?

   Related Questions in Microeconomics

  • Q : More elastic demand for labor The

    The demand for labor is more elastic the: (i) larger labor costs are like a proportion of total costs. (ii) shorter the time interval considered. (iii) greater the supply of labor. (iv) more difficult this is to substitute one resource for another. (v

  • Q : Marginal social benefits of products If

    If an oligopoly achieves equilibrium, in that case the marginal social: (w) benefits of their products exceed the marginal social costs. (x) cost of their product exceeds the marginal social benefit. (y) benefits equal the marginal so

  • Q : Positively sloped demand curve of

    When your income is positively and closely tied to the price of a specific product, a raise in its price might cause: (1) The income effect which, in severe conditions, yields a positively sloped demand curve. (2) You to go bankrupt. (3) The powerful positive substitu

  • Q : Product differentiation in gain

    Monopolistic competitors: (1) base decisions on the anticipated reactions of their many individual competitors. (2) can easily enter but not exit industries. (3) may sometimes act like monopolists and gain economic profits in the short run because of

  • Q : Substitution Effect-relative price of

    The substitution effect signifies to the change in consumption pattern as: (1) The absolute price of the good modifications. (2) Income changes. (3) The relative price of good changes. (4) The quality of good changes. Can someone p

  • Q : Break-even on profit-maximizing strategy

    Robomatic Corporation would exactly break-even upon its RoboMaids when, instead of exactly identifying its profit-maximizing strategy, this: (i) operated at point i, charging only $10,000 per unit and producing 16,000 robots. (ii) pri

  • Q : Operation in the short run of fixed

    The curves demonstrated in this figure reflect that: (i) operation in the short run since fixed costs can be measured in the graph. (ii) a disequilibrium that will force some competitors to exit this market. (iii) how firms innovate new technologies in response to pro

  • Q : Elimination of discrimination In the

    In the following diagram, the elimination of discrimination is best depicted by: 1) a move from C to E. 2) an inward shift of the production possibilities curve. 3) a move from A to D. 4) a move from E to C.

    Q : Income floor by marginal tax rate A

    A marginal tax rate of 75 percent and an income floor of ____ give in a break-even level of income of $8,000. (w) $2,000. (x) $4,000. (y) $6,000. (z) $16,000. Hello guys I want you

  • Q : Effect of decreases price ceiling on a

    A government decrease of the price ceiling upon a good will: (w) result in a decrease into the excess demand for the good. (x) result within an increase in the excess demand for the good. (y) lead to a greater quantity supplied. (z) cause a reduction