--%>

Simulated demand

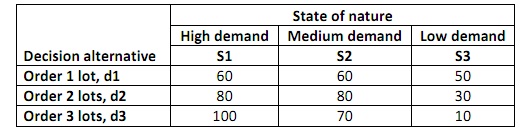
A department store faces a decision for a seasonal product for which demand can be high, medium or low. The purchaser can order 1, 2 or 3 lots of this product before the season begins but cannot reorder later. Profit projections (in thousands of euro) are shown below:

1220_simulated demand.jpg

1. If the probabilities are 0.3 for high, 0.3 for medium and 0.4 for low, what is the recommended order quantity? Calculate the expected return based on these values.

2.  Simulate twenty seasons and identify the recommended order quantity from this simulation ?

3. Calculate the average return based on the simulated demand and compare your result with the expected return ?

   Related Questions in Microeconomics

  • Q : Demand of consumers-supply of seller

    Consumers’ demand prices and sellers’ supply prices may be different in equilibrium due to: (w) arbitrage. (x) expectations about availability. (y) the invisible hand. (z) government subsidies or tax wedges.

  • Q : Reform National Welfare Before the

    Before the national welfare reform of 1996s, where Aid to Families with Dependent Children [AFDC]: (w) was the principal government program intended to alleviate poverty. (x) was exempt from any form of taxation. (y) generated pressur

  • Q : Requirement of production costs

    Decreasing average production costs needs raising the size of a firm when the raised production encounters economies of: (i) Growth. (ii) Coordination. (iii) Growth. (iv) Scale. (v) Scope. Find out the right answer from the above o

  • Q : Barriers prevent entry in monopoly

    Monopolists are more probable to generate economic profits within the long run than are pure competitors since: (w) monopolists are crooks. (x) monopolists are more interested in profits. (y) barriers prevent entry by new firms in a m

  • Q : Define Optimal Sample Size Optimal

    Optimal Sample Size: The optimal or suitable size of sample in a survey or poll is the function of four discrete factors: 1. Size of the population: The size of the

  • Q : Problem on cost curve The following

    The following diagram illustrates the short-run average total cost curves for five different plant sizes of any firm. The shape of each curve reflects: 1) increasing returns, followed by diminishing returns. 2) economies of scale, followed by diseconomies of scale. 3)

  • Q : Unstable Cartel Agreement Cartel

    Cartel agreements tend to be unstable since: (1) outputs are homogenous. (2) cooperation replaces competition. (3) all governments oppose cartels. (4) members have incentives to cheat. (5) All of the above. Hello g

  • Q : Ratios of personal benefits in Welfare

    Welfare is explained as being received while: (w) the ratios of personal benefits received by government programs associate to taxes paid are greater than for the average citizen. (x) economic rents are earned by owners of inputs. (y) a productive inp

  • Q : Increase in demand for Normal Goods

    Zelda’s purchases of bigger and more cubic zirconium rings since she got a big pay raise are an illustration of a/an: (i) Raise in demand. (ii) Raise in quantity demanded. (iii) Raise in supply. (iv) Deterioration of the tastes.

    Q : Destitute Percentage of Income The

    The percentage of American families that stay put destitute year after year is around: (w) 1 2%. (x) 3 5%. (y) 5 7%. (z) 8 10%. Hello guys I want your advice. Please recommend some views for above Economics problem