Short run supply of an industry
The cranberry industry’s short-run supply is demonstrated as: (i) curve A. (ii) curve B. (iii) curve E. (iv) curve F. (v) curve G. How can I solve my Economics problem? Please suggest me the correct answer.
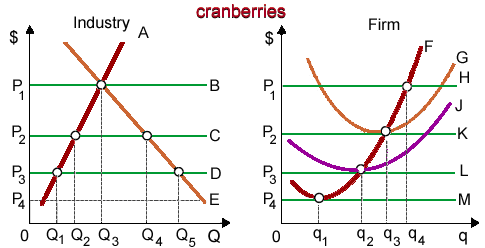
The cranberry industry’s short-run supply is demonstrated as: (i) curve A. (ii) curve B. (iii) curve E. (iv) curve F. (v) curve G.
How can I solve my Economics problem? Please suggest me the correct answer.
When the Bank of England issues perpetuities which pay of £100 yearly, forever, beginning one year by today, in that case at an interest rate of 5 percent the price of that bonds is: (1) £9,500. (2) £5,000. (3) £2,000. (4) &pou
Natural barriers to entry within a market arise primarily by: (w) strategies by existing firms to discourage the entry of new firms. (x) perfectly inelastic demands for products. (y) the declining cost structure inherent in producing certain goods. (z
Please help me to solve the problem that is given below: A relatively price elastic demand curve would consist of a coefficient of elasticity of as: (w) ep = 1. (x) ep > 1. (y) ep < 1. (z) ep
Give the answer of following question .A market: A) reflects upsloping demand and downsloping supply curves. B) entails the exchange of goods, but not services. C) is an institution that brings together buyers and sellers. D) always requires face-to-face contact betwe
When a monopolist reaches equilibrium: (1) its profits are at a maximum. (2) price equals marginal cost. (3) average cost is at its minimum. (4) marginal cost is at a minimum. Can someone explain/help me with best solution about pr
Nominal interest rates are: (w) always identical to real interest rates. (x) the percentage of monetary premiums paid per time era for the use of money. (y) determined by the size of economic rents. (z) the percentage of purchasing power transferred b
I have a problem in economics on Illustration of Rational Ignorance. Please help me in the following question. Supposing that the meat you purchase from a grocery store is good devoid of inspecting its quality yourself with the microscope is an illustration of: (1) Be
When transaction costs exist, in that case taxes on what appear to be pure economic rents to: (1) pose especially severe problems for economic efficiency. (2) may be inefficient since taxes reduce incentives to put resources to their
The demand curve facing a purely competitive seller is: (a) negatively sloped. (b) horizontal at the market price. (c) vertical at the market quantity. (d) the horizontal summation of all potential buyers’ individual demand curves. (e) market de
I have a problem in economics on Problem concerning Exploitation. Please help me in the given question. Whenever resource suppliers are salaried less than the values of their marginal products [or VMPs], then they are stated to be: (i) Monopsonistic.
18,76,764
1957340 Asked
3,689
Active Tutors
1439687
Questions Answered
Start Excelling in your courses, Ask an Expert and get answers for your homework and assignments!!