--%>

Short-run equilibrium of purely competitive industry

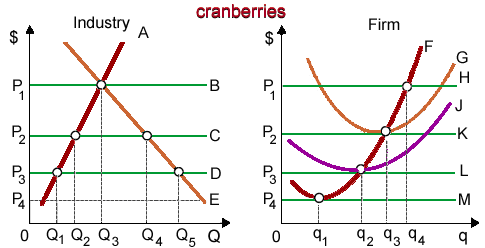
At the price P1, the given figure of purely competitive cranberry industry is within: (w) long-run equilibrium. (x) short-run equilibrium. (y) market period disequilibrium. (z) short-run disequilibrium.

2157_demand and supply.png

Can someone explain/help me with best solution about problem of Economics...

   Related Questions in Microeconomics

  • Q : Problem regarding market demand curve

    Hey friends I need your help for illustrated figure in below where for cranberries, the market demand curve is: (i) A. (ii) B. (iii) F. (iv) J. (v) E. 1579_</span></p>
                                        </div>
                                        <!-- /comment-box -->
                                    </li>
   
   </td>
	</tr><tr>
		<td>
       
      <li>
                                        <div class=

    Q : Numerical question regarding demand At

    At $1.50 per gallon, Alana purchases 50 gallons of gasoline weekly, Bart purchases 20 gallons weekly, and Caitlin purchases 20 gallons weekly. One point on their joint demand curve for gasoline would be Q =: (1) 90 gallons per week, P = $1.50. (2) 90 gallons per week,

  • Q : Determine competitive price of purely

    In this demonstrated figure purely competitive lumber mill’s generic 2×4s now sell for: (1) $3.60 each. (2) $3.00 each. (3) $2.70 each. (4) $2.40 each. (5) $2.10 each.

    Q : Depreciation expense The Realto Theatre

    The Realto Theatre purchased a new projector costing $37,000 on January 1, 2010. Since of changing technologies, the projector is predictable to last five years after which it will be obsolete and contain a salvage value of $1,000 as a collectors item. Compute the

  • Q : Saving and the Supply of Loanable Funds

    The principal eventual lenders/savers within financial markets are: (w) business firms. (x) the government. (y) households. (z) foreign investors. I need a good answer on the topic of Economics pro

  • Q : Pretax -posttax and transfer

    Refer to the following diagram. If line b represents the pretax and transfer distribution of income in the United States, we would expect the post-tax and transfer distribution to be: A) line a. B) line b, because taxes and transfers have no effect on income distribut

  • Q : When is demand more elastic at a price

    Along this demonstrated in below demand curve for DVD games, demand is more elastic at a price of: (w) $10. (x) $6. (y) $1. (z) zero.

    Q : Formation of a cartel This would be

    This would be easiest to form a cartel between: (w) retail grocers. (x) aluminum producers. (y) dairy farmers. (z) domestic marijuana producers. Can anybody suggest me the proper explanation for given problem regar

  • Q : Intending negative income tax The

    The negative income tax suggestions: (w) are intended to simplify federal income taxes. (x) require the poor to pay taxes regardless of their incomes. (y) call for higher income taxes on transfer payments. (z) are attempts to balance the goals of equi

  • Q : Expectations about future housing prices

    The market demand curve for latest houses would shift in response to a modification in: (i) Housing prices. (ii) The costs of lumber. (iii) Construction technology. (iv) Expectations regarding future housing prices.

    Discover Q & A

    Leading Solution Library
    Avail More Than 1421415 Solved problems, classrooms assignments, textbook's solutions, for quick Downloads
    No hassle, Instant Access
    Start Discovering

    18,76,764

    1934864
    Asked

    3,689

    Active Tutors

    1421415

    Questions
    Answered

    Start Excelling in your courses, Ask an Expert and get answers for your homework and assignments!!

    Submit Assignment

    ©TutorsGlobe All rights reserved 2022-2023.