--%>

Saving schedule

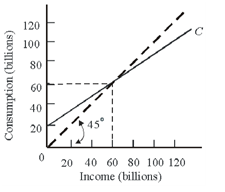
Refer to the given figure.Choose the right answer from following. If the relevant saving schedule were constructed: A) saving would be minus $20 billion at the zero level of income. B) aggregate saving would be $60 at the $60 billion level of income. C) its slope would be 1/2. D) it would slope downward and to the right

1794_1.png

   Related Questions in Microeconomics

  • Q : Problem on falling income causes

    I have a problem in economics on Problem on falling income causes increase in demand. Please help me in the following question. If falling income causes the demand for a good to rise, it is an: (1) Inferior good. (2) Costly biological necessity. (3) N

  • Q : Problem on certainty of punishment

    Raising the severity and certainty of punishment decreases the cheating on examinations. This statement imitates: (1) Misplaced cynicism as this issue is ethical, not economic. (2) Purely normative views of the behavior. (3) Unrealistic expectations regarding student

  • Q : Maximum possible total revenue by sales

    Maximum possible total revenue by sales of the especially popular St. Valentine’s Day software is about: (i) $140 million. (ii) $250 million. (iii) $350 million. (iv) $420 million. (v) $1 billion.

    Q : Purely competitive buyers and sellers

    Purely competitive buyers and sellers are: (w) price-takers. (x) price-makers. (y) powerless to make decisions. (z) quantity-takers. Hello guys I want your advice. Please recommend some views for above Econ

  • Q : Tax burden distribution of relatively

    Demands for alcoholic and tobacco beverages tend to be relatively price inelastic and income inelastic. There per unit “sin taxes” upon these products will share out the tax burden: (i) proportionally among high-income and

  • Q : Income Distribution and Satisfaction

    The proposition which taxing the rich to provide to the poor improves social welfare can’t be proved due to the impossibility of: (1) developing a political consensus about efficient redistribution programs. (2) the marginal utility of income di

  • Q : Economically inefficient level of output

    A monopolist produces an economically inefficient level of output since: (i) the difference among marginal revenue [MR] and marginal costs [marginal costs [MC] is maximized. (ii) P > average total costs [ATC], therefore MSB < MSC. (iii) all cons

  • Q : Explain Production Possibility curve

    Elucidate Production Possibility curve with the help of a diagram? Answer: The Production Possibility Curve refers to a curve that shows various production possibil

  • Q : Value of Nonhuman Wealth The most

    The most unequally variable distributed for U.S. data would most likely be: (1) pre-tax and pre-transfer incomes 1929. (2) incomes after taxes and transfers 1975. (3) the value of nonhuman wealth 2005. (4) incomes after taxes and transfers 2005. (5) incomes before tax

  • Q : Purely competitive market demand of

    When the income distribution is acceptable and no externalities survive, purely competitive market demand curves as: (w) also marginal social benefits curves. (x) inverted marginal social cost curves. (y) horizontal at the market pric