The below table presents the three possible states for stocks A and B returns.
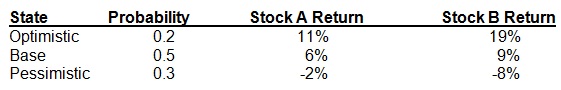
(a) Determine the expected returns and the standard deviations on Stocks A and B?
(b) Determine the expected return and standard deviation of a portfolio with weights of 35% in Stock A and the remainder in Stock B?
(c) Determine the correlation coefficient between stocks A and B? Interprete this outcome.