--%>

Resource prices

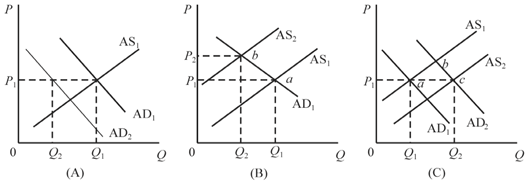
Refer to the following diagrams, in which AD1 and AS1 are the "before" curves and AD2 and AS2 are the "after" curves. Other things equal, a decrease in resource prices is depicted by:1) panel (A) only. 2) panel (B) only. 3) panel (C) only. 4) panels (B) and (C)


880_2.png

Help me to go through this problem.

   Related Questions in Microeconomics

  • Q : Equilibrium quantity and price

    Elucidate the consequence of an increase in demand of a commodity on its equilibrium quantity and price? Answer: Increase in demand causes a rightward shift in the

  • Q : Function of Capitalization Winning

    Winning $50,000 yearly for 20 years is similar as winning: (w) $1 million today. (x) less than $1 million today. (y) more than $1 million today. (z) $100 per day, forever. Hello guys I want your advice. Please recommend some views

  • Q : Problem on deadweight loss Assume that

    Assume that the domestic demand for television sets is explained by Q = 40,000 − 180P and that the supply is provided by Q = 20P. When televisions can be freely imported at a price of $160, then how many televisions would be generated in the domestic market? By

  • Q : Long run supply Illustrate and explain

    Illustrate and explain using diagrams, the difference between long run supply in a constant cost individual firm and industry and an increasing cost firm and industry.

  • Q : Diagonal line in perfect equality of

    The ratio of the area among the diagonal line of perfect equality and the Lorenz curve to the total area in the diagonal is the: (1) poverty index. (2) human capital coefficient. (3) needs coefficient. (4) negative-tax index. (5) Gini index.

  • Q : Help The problem of asymmetric

    The problem of asymmetric information is that

  • Q : Law of Demand in respect to relative

    I have a problem in economics on Law of Demand in respect to relative price. Please help me in the following question. The law of demand defines that as: (1) Absolute prices rise, quantity demanded raises. (2) Relative prices raise, quantity demanded

  • Q : When Shortages occur Shortages take

    Shortages take place whenever the market price: (1) Most greatly surpasses the average person’s demand price. (2) Is above the usual seller’s supply price. (3) Equivalents production costs plus the maximum possible gain. (4) Lies beneath t

  • Q : Problem regarding rise in quantity

    Can someone please help me in finding out the accurate answer from the following question. The raise in the quantity supplied of frozen vegetarian lasagna would be most probable to outcome from raise in the: (i) cost of ingredients in the vegetarian lasagna. (ii) Numb

  • Q : Demonstrates the Lorenz Curve This

    This given figure demonstrates as: (w) Lorenz curve. (x) familial income distribution graph. (y) Gini curve. (z) Blanc income standard curve. </span></p>
                                        </div>
                                        <!-- /comment-box -->
                                    </li>
   
   </td>
	</tr>
</table>


                                </ul>
                                <!-- /user-comments-list -->
                            </div>
                        </div>
                    <div  class=

    Discover Q & A

    Leading Solution Library
    Avail More Than 1453679 Solved problems, classrooms assignments, textbook's solutions, for quick Downloads
    No hassle, Instant Access
    Start Discovering

    18,76,764

    1929750
    Asked

    3,689

    Active Tutors

    1453679

    Questions
    Answered

    Start Excelling in your courses, Ask an Expert and get answers for your homework and assignments!!

    Submit Assignment

    ©TutorsGlobe All rights reserved 2022-2023.