--%>

Resource market in equilibrium

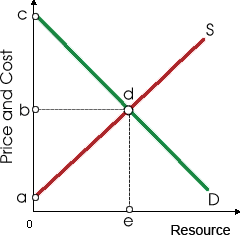
When the resource market demonstrated in this figure is into equilibrium: (1) owners of these resources currently receive no economic rents. (2) economic rent is specified from trapezoid Oade. (3) the rectangle Obde measures consumer surplus by the final output. (4) economic rent equals triangle abd. (5) economic rent equals triangle bcd.

958_Problem on Economic Rent.png

I need a good answer on the topic of Economics problems. Please give me your suggestion for the same by using above options.

   Related Questions in Microeconomics

  • Q : Why demand curve face monopolistically

    Why is demand curve facing a monopolistically competitive firm probable to be very elastic?

  • Q : Monopoly and competition theory The

    The theorist who set the stage for much of the “new” theory of international trade through blending theories of monopoly and competition to suit the case of several sellers offering differentiated products was: (1) Leon Walras. (2) Vilfred

  • Q : Describing monopoly Illustrate the term

    Illustrate the term monopoly?

  • Q : Point of hiring labor for profit

    The entire profit maximizing firm will hire additional labor up to the point where the: (i) Average physical product of the labor equivalents the nominal wage. (ii) Last unit of labor adds equally to net revenue and net cost. (iii) Marginal product of the labor is at

  • Q : Arbitrager-individual or organization

    The arbitrager is an organization or individual that will: (1) Simultaneously purchase low and sell high in various markets. (2) Create disparities among prices in various markets. (3) Resolve disputes among sellers and consumers. (4) Purchase low and

  • Q : Price signalling reallocations in use

    An illustration of prices signalling desirable reallocations would happen while rising product demand leads to rising: (w) levels of investment during the economy. (x) employment of resources producing such good. (y) shifts of resources within other outputs. (z) quick

  • Q : Attribute Demand Curve for Bonds A

    A demand curve for bonds moving to the right is probably to be attributable to: (w) a business cycle recession. (x) lower expected (future) interest rates. (y) an increase into the expected rate of inflation. (z) an increase in the liquidity of altern

  • Q : Analytic time in market structure In

    In this figure the firm probably to go out of business the soonest would be as: (w) Firm A. (x) Firm B. (y) Firm C. (z) Firm D. 298_Market Str</span></p>
                                        </div>
                                        <!-- /comment-box -->
                                    </li>
   
   </td>
	</tr><tr>
		<td>
       
      <li>
                                        <div class=

    Q : Unexpected inventory growth of price

    These supply and demand curves within the sugar market specify that: (w) a price floor of P0 for sugar will cause a surplus. (x) a price ceiling of P2 will cause a shortage. (y) the market clears while quantity equals Q0

  • Q : Profit-maximizing monopolists I have a

    I have a problem in economics on Profit-maximizing monopolists. Please help me in the following question. Profit-maximizing monopolists exploit the labor since: (i) Workers are paid very less than the value of their average physical products. (ii) The