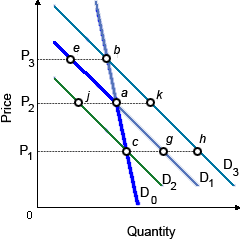
In this demonstrated figure kinked demand curve model, when a firm at point a raises or lowers its price and the rest of the firms in the industry do similar thing, in that case the relevant demand curve for the firm is: (w) demand curve D0. (x) demand curve D1. (y) demand curve D2. (z) demand curve D3.
Can anybody suggest me the proper explanation for given problem regarding Economics generally?