--%>

Relatively less elasticity of demand

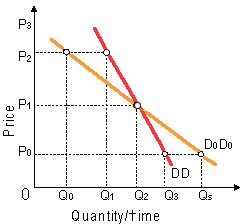
Relative to demand curve D0D0, demand curve DD: (i) is relatively more elastic than D0D0 at a price of P1. (ii) is relatively more elastic than D0D0 at a price of P2. (iii) is relatively less elastic for every quantity which would be purchased through both consumers. (iv) probably represents a good that absorbs a higher proportion of the consumer's income. (v) probably has fewer close complements than the good reflected on D0D0.

1353_Slope and Elasticity2.png

Hey friends please give your opinion for the problem of Economics that is given above.

   Related Questions in Microeconomics

  • Q : Goal of a cartel The objective of a

    The objective of a cartel is to: (w) permit every member firm to maximize profit. (x) foster competition among sellers. (y) enhance efficiency and lower prices to consumers by eliminating several wasteful forms of competition. (z) maximize the joint p

  • Q : Coefficient of price elasticity Why the

    Why the coefficient of price elasticity of demand is is negative?

  • Q : Human Capital-General Training The

    The knowledge regarding local trees and shrubs which Morgan learns as working as an apprentice landscaper in suburbs of a big city is an illustration of the advantages from: (i) Dirty work. (ii) Dues-paying. (iii) General training. (iv) High-skilled employment. (v) Sp

  • Q : Theory of mercantilism Explain what was

    Explain what was the theory of mercantilism?

  • Q : Taxes on pure land rent Taxes on pure

    Taxes on pure land rents: (1) especially distort economic behavior. (2) are forward shifted to consumers. (3) transfer income from the public treasury to private landowners. (4) are allocatively neutral relative to most alternative taxes. (5) are over

  • Q : Long-run competitive pressures in

    When economic losses are widespread within a purely competitive industry, in that case long-run competitive pressures tend to cause: (i) accelerating economic losses. (ii) prices to fall while firms leave the industry. (iii) productio

  • Q : Charting of past prices Can the

    Can the charting of past prices be used to predict future prices?

  • Q : Short run operations of a

    This figure in below is demonstrates the operations of a profit-maximizing pure competitor into the: (1) market period. (2) short run. (3) long run. (4) super long run since this can alter technology. (5) shutdown range of production.

    Q : Graphical relationship depicted by

    Demand curves graphically depict the relationships which are: (i) Positive among the demand for a good and its relative price. (ii) Negative between the quantity demanded and the opportunity cost of a good. (iii) Positive between income and expenditures. (iv) A horizo

  • Q : Resource prices Refer to the following

    Refer to the following diagrams, in which AD1 and AS1 are the "before" curves and AD2 and AS2 are the "after" curves. Other things equal, a decrease in resource prices is depicted by:1) panel (A) only. 2) panel (B) only. 3)