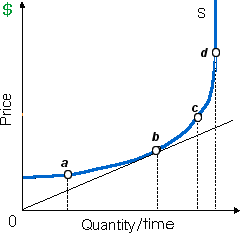
At point c, in illustrated figure the supply curve into this graph is: (w) perfectly price elastic. (x) relatively price elastic. (y) unitarily price elastic. (z) relatively inelastic.
I need a good answer on the topic of Economics problems. Please give me your suggestion for the same by using above options.