Relatively elasticity in supply curve
At point a, in below figure the supply curve into this graph: (w) perfectly elastic. (x) relatively elastic. (y) unitarily elastic. (z) relatively inelastic. How can I solve my Economics problem? Please suggest me the correct answer.
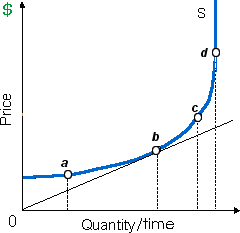
At point a, in below figure the supply curve into this graph: (w) perfectly elastic. (x) relatively elastic. (y) unitarily elastic. (z) relatively inelastic.
How can I solve my Economics problem? Please suggest me the correct answer.
I have a problem in economics on how changes in weather affect agricultural output. Please help me in the following question. Economists consider how changes in the weather influence the agricultural output as: (i) Signs of ecological imbalances. (ii) Technological mo
Price discrimination occurs when a good is: (1) priced by a formula yielding monopoly profit. (2) denied to customers who refuse to pay the going price. (3) sold at different prices not reflecting differences in costs. (4) subject to government price
The social goal of providing the biggest happiness to the most people is intent to practice the: (i) Precautionary discretion. (ii) Classical theory. (iii) Utilitarianism. (iv) Speculative balances. (v) Arbitrage. Can someone pleas
I have a problem in economics on Workers in monopsonistic labor markets. Please help me in the following question. The workers in monopsonistic labor markets receive salaries: (i) That barely cover the subsistence. (ii) Beneath the value of marginal p
I have a problem in economics on Market Power and the Demand for Labor. Please help me in the given question. The lack of competition in product market outcomes in: (1) Less labor being hired than when the markets were competitive. (2) Many labor bein
Abnormal profit: It is the gain earned over and above the normal profit.
When the resource market demonstrated in this figure is into equilibrium: (1) owners of these resources currently receive no economic rents. (2) economic rent is specified from trapezoid Oade. (3) the rectangle Obde measures consumer surplus by the fi
Fully explain the term Bond Ratings?
When the market price is lower to cover average total costs, in that case a profit-maximizing firm will: (i) shut down instantly. (ii) continue to operate where P = MC when P > AVC. (iii) adopt newer technology. (i
The law of diminishing marginal utility might be evidenced by the person: (i) Smoking more however enjoying it less. (ii) Purchasing a new car subsequent to getting an increase. (iii) Distributing excess food to starving children. (iv) Who studies muc
18,76,764
1938689 Asked
3,689
Active Tutors
1456399
Questions Answered
Start Excelling in your courses, Ask an Expert and get answers for your homework and assignments!!