--%>

Reflecting normal substitution by market demand curve

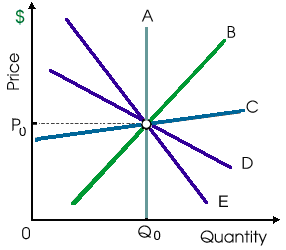
When consumer demand for this industry’s product is relatively inelastic, in that case the curve reflecting normal substitution although the least price elasticity of market demand would be of: (i) curve A. (ii) curve B. (iii) curve C. (iv) curve D. (v) curve E.

1785_purely competitive industry.png

Can anybody suggest me the proper explanation for given problem regarding Economics generally?

   Related Questions in Microeconomics

  • Q : Labour economics Imagine Roger is

    Imagine Roger is contemplating going to school to complete a masters degree in the current period while working part time instead of full time. There are six relevant periods of his work lif, periods t=0,1,2...5. HIs earnings each period if he gets the additional education are given by Yt=100+200t

  • Q : Pure competition and monopolistic

    Pure competition and monopolistic competition are: (1) polar opposites on the continuum of market structures. (2) the two market structures in that firms are pure quantity adjusters. (3) both characterized by an absence of barriers to long run entry a

  • Q : Equilibrium moves market increase in

    When equilibrium moves from point a to point b, the simple market experiencing a raise in supply is demonstrated within: (w) Panel A. (x) Panel B. (y) Panel C. (z) Panel D.

    Q : Analytic time of corn harvest The

    The period after one corn harvest is done and before the subsequent corn harvest begins is the: (1) short-run. (2) intermediate period. (3) long-run. (4) market period. (5) fiscal year for budgeting. Can someone explain/help me wit

  • Q : Low-income elasticities of demand

    Placing an excise tax upon goods along with low-income elasticities of demand will share out the tax burden as: (1) proportionally between high-income and low-income households. (2) disproportionately on high-income households. (3) disproportionately

  • Q : Problem on Substitution effect for good

    One of my friend has a problem on substitution effect. The original equilibrium point (that is utility-maximizing bundle) in the graph shown below is at point A. The price of good Y is increased, pivoting the budget constraint down to its latest level.a. F

  • Q : Minimum Wage Laws-Unemployment Rises in

    Rises in the legal minimum wage rate have not been answerable for rising: (i) Unemployment among the teenagers. (ii) Racial discrimination in the employment. (iii) Unemployment between skilled workers who have lost their jobs since of competition from the cheaper impo

  • Q : Generates price and a quantity

    All prospective suppliers [sellers] would be in equilibrium when this market for teleporter buttons created a price and a quantity consistent along with: (1) eliminating the shortage Q1-Q3 existing at P3. (2) any point along the demand

  • Q : Average variable cost curve of firm Can

    Can someone specify correct answer of the given query of demonstrated figure in below that curve J is that cranberry of: (w) industry’s supply curve. (x) firm’s demand curve. (y) firm’s average variable cost curve. (z) firm’s short-run supply c

  • Q : Problem on Boycotts People who reject

    People who reject to purchase the products of a firm whose actions they condemn, especially when such rejection is intended to support the employees who are on strike, and who urge others to not purchase such products, or to not deal with these firms, are engaged in a