Japanese rice producers have tremendously high production costs, in part because of the high opportunity cost of land and to their inability to take benefit of economies of large-scale production. Analyze two policies intended to maintain Japanese rice production: (1) a per-pound subsidy to farmers for every pound of rice produced, or (2) a per-pound tariff on imported rice. Show with supply-and-demand diagrams the equilibrium price & quantity, government revenue or deficit, domestic rice production, and deadweight loss from each policy. Which policy is the Japanese government likely to prefer? Which policy are Japanese farmers likely to prefer?
Figure (a) illustrates the gains and losses from a per-pound subsidy along with domestic supply, S, and domestic demand, D. PS is the subsidized price, PB refers to the price paid by the buyers, and PEQ is the equilibrium price without the subsidy, assuming no imports. Along the subsidy, buyers demand Q1. Farmers gain amounts equivalent to areas A and B. It is the increase in producer surplus. Consumers gain areas C and F. It is the increase in consumer surplus. Deadweight loss is equivalent to the area E. The government pays a subsidy equal to areas A + B + C + F + E.
Figure(b) illustrates the gains and losses from a per-pound tariff. PW is the world price, and PEQ is the equilibrium price. Along the tariff, assumed to be equal to PEQ - PW, buyers demand QT, farmers supply QD, and QT - QD is imported. Farmers gain surplus equivalent to area A. Consumers lose areas A, B, C; it is the decrease in consumer surplus. Deadweight loss is equivalent to the areas B and C.
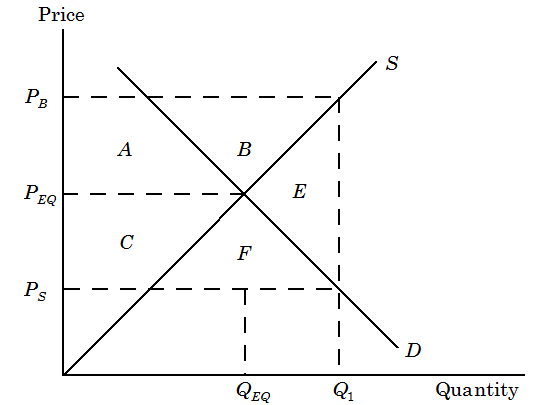
Figure (a)
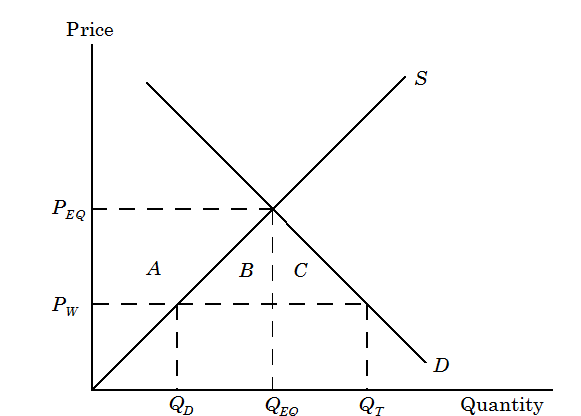
Figure (b)
Without more information regarding the size of the subsidy & the tariff, and the particular equations for supply & demand, it seems sensible to suppose that the Japanese government would avoid paying subsidies by selecting a tariff, but the rice farmers would prefer the subsidy.