Question on production possibilities curve
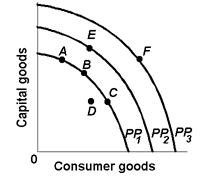
Refer to the given diagram. Which of the following positions relative to PP1 would be the most likely to result in a future production possibilities curve of PP3, rather than PP2 ? 1) A. 2) B. 3) C. 4) D. Help me in getting through above question
Refer to the given diagram. Which of the following positions relative to PP1 would be the most likely to result in a future production possibilities curve of PP3, rather than PP2 ? 1) A. 2) B. 3) C. 4) D.
Help me in getting through above question
Question: (a) Suppose the income elasticity of demand for pre-recorded music compact disks is +4 and the income elasticity of demand for a cabinet maker's work is +0.4. Compare the impact on pre-recorde
What is the Expected Rate of Inflation. Illustrate the term.
What do you mean by Gross Domestic Product of Norway?
Define monetary policy? What monetary measure can be accepted to control the condition of excess demand? It is the policy accepted by central bank exercising control over money rate of interest and credit situatio
Rises in the legal minimum wage rate have not been answerable for rising: (i) Unemployment among the teenagers. (ii) Racial discrimination in the employment. (iii) Unemployment between skilled workers who have lost their jobs since of competition from the cheaper impo
Normal 0 false false
Techniques of how to produce?: Broadly, there are two main methods of production. (i) Labour intensive Technique: Under this method, production depends mostly on the
When the annual interest rate is 12 percent and a rental house can be expected to rent perpetually for price of $1,000 monthly, in that case the house has a present value of approximately: (1) $240,000. (2) $144,000. (3) $100,000. (4) $72,000. (5) $12
I have a problem in economics on Proprietorships and corporations. Please help me in the following question. Most of the firms in United States are organized as ________, however two-third of all gain is received by the _________. (1) Corporations; restricted partners
A purely competitive firm: (w) faces a perfectly inelastic demand curve. (x) sets its own price. (y) is a price taker. (z) sells a differentiated product. Can someone explain/help me with best solution about proble
18,76,764
1929521 Asked
3,689
Active Tutors
1455922
Questions Answered
Start Excelling in your courses, Ask an Expert and get answers for your homework and assignments!!