--%>

Quantity demands equivalent quantity supply

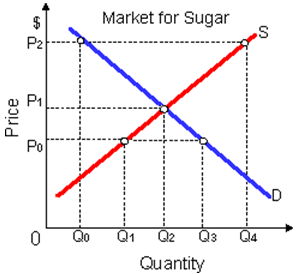
These supply and demand curves for sugar propose that the: (1) demand price exceeds the supply price at quantity Q2. (2) technology should advance to allow output to develop to Q4. (3) quantity demanded equals quantity supplied at P1. (4) market experiences a shortage at P2. (5) government has set an effectual price floor at P02.

1875_example of Equilibrium.png

How can I solve my economics problem? Please suggest me the correct answer.

   Related Questions in Microeconomics

  • Q : Surviving firms in declining

    When firms exit a declining competitive industry, in that case surviving firms will: (i) reduce their outputs and prices. (ii) experience higher prices and profits. (iii) automate to adjust to lower wages. (iv) sell more output at lower prices. <

  • Q : Characteristics of a purely competitive

    NOT between characteristics of a purely competitive industry would be as: (w) large numbers of potential buyers and sellers. (x) long-run freedom of entry and exit. (y) modern technology that dictates large firms. (z) buyers have no influence on price

  • Q : Supply of bonds for demand for loanable

    An increase in the supply of bonds tends to: (1) reduce the interest rate. (2) occur simultaneously with an increase in the demand for loanable funds. (3) yield an increase gross investment but a decrease in net investment. (4) drive up the prices of

  • Q : Horizontal demand curve facing purely

    The demand curve facing a purely competitive firm is: (w) horizontal. (x) vertical. (y) downward sloping. (z) the horizontal summation of individual demand curves. Can someone explain/help me with best solution abo

  • Q : What is technological advance Broadly

    Broadly defined, technological advance: A) can occur in either the short run, long run, or very long run. B) comprises new and improved goods and services and new and improved ways of producing or distributing them. C) includes invention, but not innovation or diffusi

  • Q : Variation in demand and supply with

    It shifts within the demand for new textbooks from D0 to D1 may be a result of: (1) increased enrollments of students. (2) consumers' expectations of a future increase within the price of textbooks. (3) increased literacy rates. (4) increasingly efficient E-

  • Q : Economic profits with average total

    A monopolist can produce economic profits while: (w) average fixed costs [AFC] are very high. (x) average total costs [ATC] lies above the demand curve. (y) at least some portion of the average total costs [ATC] curve lies below the d

  • Q : Arc elasticity for labor of demand The

    The arc elasticity of Bosun’s demand for labor between point d and point e is roughly: (1) one. (2) 1.25. (3) 2.50. (4) 3.75. (5) 5.00.

    Q : Compute Gini Index The areas

    The areas illustrates in this Lorenz diagram can be used to compute a Gini index as: (i) (cow + pig)/cow. (ii) cow2/(cow + pig).  (iii) pig2/(cow + pig). (iv) cow/(cow + pig) (v) (cow + horse)/pig.

    Q : Determine demand when equilibrium

    Car prices and sales such that the costs per mile of auto passenger travel, and whole passenger miles driven have all rose from the 1940 year, demonstrating that: (w) auto travel is an inferior good. (x) the demand for auto travel is positively sloped. (y) the law of