--%>

Quantity demand declines back and up in auto market

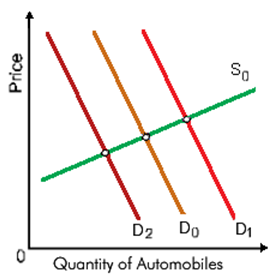
Suppose that the auto market started at the intersection of S0 and D0, and subsequently higher labor costs drove up prices for latest cars. How will it influence the market for automobiles?: (w) Higher wages for auto workers drive up the total market demand. (x) Demand shifts to D2. (y) Demand shifts to D1. (z) The quantity demanded declines back and declines up along D0.

997_quality of automobiles.png

Please choose the right answer from above...I want your suggestion for the same.

   Related Questions in Managerial Economics

  • Q : Evan J Douglass definition of

    What is the Evan J Douglas’s definition of Managerial economics?

  • Q : Increases in demand for a resource The

    The demand for a resource would increase while the: (w) price of which resource decreases. (x) price of a substitute resource decreases. (y) consumer demand for products decreases. (z) price of a complementary resource decreases.

  • Q : Wage rate and labor in supplying By the

    By the following choices in this illustrated graph, this worker would be happiest at point: (w) point a. (x) point b. (y) point c. (z) point d.

    Q : Smoothing techniques or Exponential

    Explain about the term smoothing techniques.

  • Q : Elasticity of the Supply of Labor of

    This supply of labor worker is roughly unitarily wage elastic as the wage rate increases from: (1) $5 per hour to $10 per hour. (2) $5 per hour to $25 per hour. (3) $10 per hour to $25 per hour. (4) $10 per hour to $40 per hour. (5) $25.01 per hour to

  • Q : Saving of production costs attributable

    The rental value of a high quality piece of agricultural land timely era is: (w) negatively associated to the price of agricultural output this could produce. (x) unrelated to the costs of its cultivation. (y) equal to the saving of production costs a

  • Q : Most wage elastic demand for labor For

    For labor Plastibristle’s demand is most wage elastic at: (1) point a. (2) point b. (3) point c. (4) point d.

    Q : Trent projection statistical method of

    Explain the Trent projection statistical method of Demand Forecasting.

  • Q : Earning price in Human capital As per

    As per shown in this graph, the average high school graduate will earn around: (1) $12,000 yearly. (2) $20,000 yearly. (3) $45,000 yearly. (4) $90,000 yearly. (5) $100,000 yearly.

    Q : Demand for labor between two points in

    The arc elasticity of Plastibristle’s demand for labor between point a and point b is: (1) 0.375. (2) 0.667. (3) 0.833. (4) 1.200 (5) 2.000.

    Discover Q & A

    Leading Solution Library
    Avail More Than 1460673 Solved problems, classrooms assignments, textbook's solutions, for quick Downloads
    No hassle, Instant Access
    Start Discovering

    18,76,764

    1950264
    Asked

    3,689

    Active Tutors

    1460673

    Questions
    Answered

    Start Excelling in your courses, Ask an Expert and get answers for your homework and assignments!!

    Submit Assignment

    ©TutorsGlobe All rights reserved 2022-2023.