--%>

Quantities in a queuing system

Quantities in a queuing system:

1242_quantities in queuieg.jpg

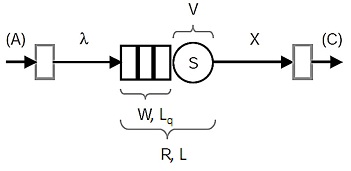
A: Count of arrivals into system throughout measurement period T

Ak: Count of arrivals into queue k throughout  measurement period T

C: Count of global system completions throughout  the period T

Ck: Count of completions which departed the queue k during T

Vk: Count of repeated visits to the server k throughout  T

λk: Arrival rate at resource k = Ak / T

R: Mean time in system (residence time)

L: Average number of requests in system

W: Mean time in queue (that is, waiting time)

Lq: Average number of waiting to be served

S: Mean service time per completed job

X: Throughput

T: Total measurement period or observation time

K: Total number of queuing nodes k in system

   Related Questions in Basic Statistics

  • Q : Write out the null hypothesis 1.

    1. (AAC/ACA c9q1).  For each of the following studies, decide whether you can reject the null hypothesis that the groups come from identical populations. Use the alpha = .05 level.1a.

  • Q : Safety and Liveness in Model Checking

    Safety and Liveness in Model Checking Approach; •? Safety: Nothing bad happens •? Liveness: Something good happens •? Model checking is especially good at verifying safety and liveness properties    –?Concurrency i

  • Q : Hw An experiment is conducted in which

    An experiment is conducted in which 60 participants each fill out a personality test, but not according to the way they see themselves. Instead, 20 are randomly assigned to fill it out according to the way they think a parent sees them (i.e. how a parent would fill it out to describe the participant

  • Q : Use the NW corner rule to find an

      (a) Use the NW corner rule to find an initial BFS, then solve using the transportation simplex method. Indicate your optimal objective function value. (b) Suppose we increase s1 from 15 to 16, and d3 from 10 to 11. S

  • Q : Probability how can i calculate

    how can i calculate cumulative probabilities of survival

  • Q : Hypothesis homework A sample of 9 days

    A sample of 9 days over the past six months showed that a clinic treated the following numbers of patients: 24, 26, 21, 17, 16, 23, 27, 18, and 25. If the number of patients seen per day is normally distributed, would an analysis of these sample data provide evidence that the variance in the numbe

  • Q : STATISTICS Question This week you will

    This week you will analyze if women drink more sodas than men.  For the purposes of this Question, assume that in the past there has been no difference.  However, you have seen lots of women drinking sodas the past few months.  You will perform a hypothesis test to determine if women now drink more

  • Q : Simplified demonstration of Littles Law

    Simplified demonstration of Little’s Law:

    Q : Point of estimate standing data se to

    standing data se to develop a point of estimate

  • Q : Problem on Model Checking Part (a).

    Part (a). Draw a state diagram for a car with the following state variables: D indicating whether the car is in drive; B indicating the brake pedal is depressed; G indicating the gas pedal is depressed; and M indicating whether the car is moving. (For example, the sta

  • ©TutorsGlobe All rights reserved 2022-2023.