--%>

Purely-competitive market demand

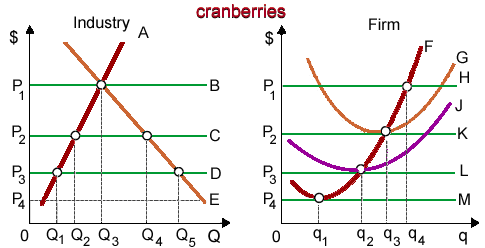
For the purely-competitive cranberry market, as in below figure there Curve H is: (i) industry’s long-run supply curve. (ii) firm’s demand curve in the short run. (iii) industry’s marginal cost curve. (iv) firm’s long run marginal cost curve.

500_demand and supply.png

Can anybody suggest me the proper explanation for given problem regarding Economics generally?

   Related Questions in Microeconomics

  • Q : Increases profit of a firm when output

    A firm would raise profits when it: (w) decreased output when MR > MC. (x) expanded output while MR > MC. (y) increased output when MC > MR. (z) shut down since MR = MC. Hello guys I want your advice. Plea

  • Q : Relative price of the good The demand

    The demand curve depicts a negative relationship among price and quantity demanded since the quantity demanded rises if there is a decline in the: (1) Size of the family. (2) Incomes of the consumer. (3) Relative price of good. (4) Price of the substitute good. <

  • Q : Externalities and Deadweight Loss

    Assume that the demand and supply for a product can be described by the following equations:Q= 1200-4PQ= -200+2P Producing the product results in marginal external damage of $8 per unit.a. What type of

  • Q : High economic profits High economic

    High economic profits for firms are least probable to arise by: (1) important market power. (2) “cut-throat” competitive pricing policies. (3) superior products. (4) unusually efficient managers. (5) price-maker behavior.

    Q : Significant monopsony power-labor market

    The firm probable to have noteworthy monopsony power in its labor market would be the: (i) Big cotton farm in the Texas hiring migrant workers. (ii) Textile manufacturer in the Hong Kong hiring the factory workers. (iii) Janitorial service organization in London hirin

  • Q : Horizontal summation of individual

    The market demand curves for most of the goods are as: (i) Cross-multiplied products of the individual demand curves. (ii) Insignificant for most of the analytical aims. (iii) The horizontal summation of the individual demand curves. (iv) Irrelevant for business decis

  • Q : Determine output by profit maximization

    LoCalLoCarbo that is the favorite corporation of fad dieters maximizes profit by making: (1) output q1 . (2) output q2 . (3) output q3 . (4) output q4 . (5) output q5 .

    Q : Economic cost Economic cost can best be

    Economic cost can best be defined as: A) any contractual obligation that results in a flow of money expenditures from an enterprise to resource suppliers. B) any contractual obligation to labor or material suppliers. C) compensations that must be received by resource

  • Q : Total revenue on profit-maximizing

    Total revenue roughly for the profit-maximizing lumber mill equivalents: (i) $1700 daily. (ii) $2500 daily. (iii) $3500 daily. (iv) $4590 daily. (v) $6000 daily.

    Q : Example of price elasticity of demand

    At P = $100, there 50 tons of Garden-Rich fertilizer are demanded within Patagonia; at P = $80, there quantity demanded is 70 tons. Therefore price elasticity of demand for fertilizer: (w) 5/8. (x) 3/2. (y) 4/5. (z) 2/3.