--%>

Purely competitive equilibrium labor market

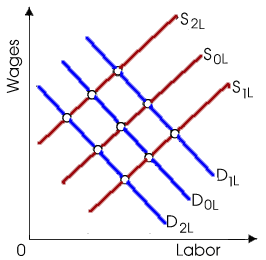
When this purely competitive labor market is firstly in equilibrium at D0L, S0L, an increase within the price of output will result into equilibrium being attained at: (w) D0L, S0L. (x) D1L, S1L. (y) D2L, S1L. (z) D1L, S0L.

2432_Labor Market Equilibria problem.png

Hello guys I want your advice. Please recommend some views for above Economics problems.

   Related Questions in Managerial Economics

  • Q : Illustrate signalling by example If

    If interviewing for a job like a bill collector for a loan shark, Bob mentions his degree into martial arts by the Hard Knox Reformatory, his summer internship along with BreakUrLegs, Inc., as well as his family links. Bob’s casual discussion of such credentials

  • Q : Examples of Economic Capital

    Landscaping a garbage dump along with topsoil, grass and trees to construct a golf course is an illustration of creating new: (i) capital. (ii) land. (iii) employment. (iv) economic profits. (v) natural resources. Please guys help

  • Q : Diminishing Marginal Productivity of

    Workers tend to be less productive at the margin like they work along with increasingly huge amounts of: (w) physical capital. (x) personal human capital. (y) technology which makes them narrow specialists. (z) labor from other people on an assembly line.

  • Q : Income and Substitution Effects When

    When the income effect of a higher wage rate is extremely powerful in that case the substitution effect, the: (1) supply curve of labor will be positively sloped. (2) demand for leisure increases like income rises. (3) human capital effect is stronger

  • Q : Illustrates the criteria for good

    Illustrates the criteria for good forecasting method?

  • Q : Welfare definition of economics Explain

    Explain the welfare definition of economics? Why is it criticized?

  • Q : Wage rate at demand of labor When the

    When the wage rate price of $13, in that case this firm would hire slightly fewer than: (i) 600 workers. (ii) 700 workers. (iii) 800 workers. (iv) 900 workers (v) 1000 workers.

    Q : Relation between Average Revenue

    Illustrates the relation between Average Revenue, Total Revenue and Marginal Revenue?

  • Q : Average rate of return in Human Capital

    This illustrated graph indicates that, there on average, rate of return to education is greatest for finishing the previous year of: (1) kindergarten, at point a. (2) grade school, at point b. (3) high school, at point c. (4) undergraduate college, at

  • Q : Illustrates the steps in formulating

    Illustrates the steps in formulating pricing policies in details?