--%>

Purely-competitive and constant-cost industry

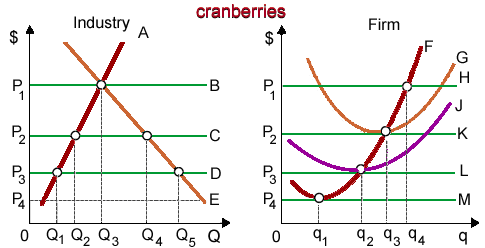
When this firm is typical into this purely-competitive of constant-cost industry, as in demonstrated figure in long-run equilibrium for cranberries will be attained at a market price of: (i) P1. (ii) P2. (iii) P3. (iv) P4. (v) Not computable from these figures.

408_demand and supply.png

Hey friends please give your opinion for the problem of Economics that is given above.

   Related Questions in Microeconomics

  • Q : Higher value for the Gini index A

    A higher value for Gini index tends to be related with: (w) decreases in the equality of the distribution of income or wealth. (x) decreases in the population’s total amount of income or wealth  (y) reduced overall curvature of the Lorenz c

  • Q : Break even and zero economic profit

    After Babble-On’s patents lapsed and entry and exit turned into possible in this illustrated figure of market, in the long run Babble-On would be expected to: (i) continue to reap economic profits. (ii) break even and experience zero economic pr

  • Q : Demands for productive resources The

    The demands for productive resources are eventually “derived” by the: (w) marginal utility they directly generate. (x) demands for consumer goods and services. (y) disutility incurred in supplying labor. (z) equity of resource owners as ju

  • Q : Determine infinity price elasticity

    When the demand for cheesy fried grits of Pixie is relatively price elastic, then its price elasticity is: (i) zero. (ii) greater than zero but less than one. (iii) one (unitary.) (iv) greater than one but less than infinity. (v) infi

  • Q : Cost structure characteristic in purely

    When Cling Peach Orchards has a cost structure characteristic of peach orchards into this purely competitive industry, when the long run new competitors would most likely enter the market providing the wholesale price per bushel of peaches exceeded: (

  • Q : Graphical shift of supply curve When

    When market supply and demand curves for Velcro shoelaces were projected into a screen at the front of this room, a raise in the supply of Velcro shoelaces would be illustrated graphically by a shift of supply curve: (1) Towards the center of Earth. (2) To the left. (

  • Q : Earning income within negative income

    Under the negative income tax system demonstrated in this figure, a family of four along with no earned income would have a net as after-tax, the income of: (1) $15,000 per year. (2) $10,000 per year. (3) $5,000 per year. (4) $2,500 per year. (5) $0 p

  • Q : Problem on Multiple regression analysis

    Find two journal articles that have undertaken multiple regression analysis and compare the results. Specify the reference for the two papers.Requirements:

    Q : Difference between increase in demand

    Difference between increase in demand and increase in quantity: Whenever demand rises at specific price then it is termed as rise in demand?. On another hand, whenever demand increases by decrease in price of a com

  • Q : Needs by marginal revenue equals to

    A monopolist produces where marginal revenue [MR] equals marginal costs [MC] when it needs to maximize: (i) total revenue. (ii) consumer surplus. (iii) profits. (iv) total revenue, producer surplus and profits. (v) job security.