--%>

Profit maximizing strategy

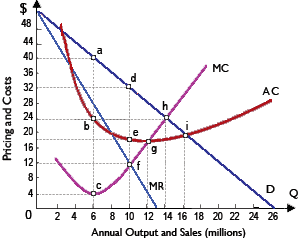
Prohibition Corporation would exactly break-even on its St. Valentine’s Day software when, in place of correctly identifying its profit maximizing strategy, this: (1) operated at point i, charging just $20 per copy and producing 16 million copies. (2) priced the software at $48 and sold just 1.8 million copies. (3) charged $32 per copy and sold 10 million copies. (4) produced 13 million copies as well as sold them for $27 apiece.

1906_software of Elasticity.png

Hey friends please give your opinion for the problem of Economics that is given above.

   Related Questions in Microeconomics

  • Q : Compare average household income How

    How you compare the average household income of the different countries?

  • Q : Barriers to entry of dominated industry

    An industry dominated by small huge firms shielded through barriers to entry is: (1) a monopoly. (2) a vertically integrated industry. (3) an oligopolistic industry. (4) an aggregated industry. (5) a cartel. I need

  • Q : Long run and short run costs I have

    I have difficulty in this question. Provide me correct solution of this to submit my assignment. What is the relationship among long run and short run costs?

  • Q : Variation in supply and demand curves

    These supply and demand curves for housing do NOT involve that the: (w) demand for housing has increased. (x) supply has increased, because rental price has risen. (y) equilibrium price and quantity of housing have increased. (z) housing market will c

  • Q : Concentration ratio explain the concept

    explain the concept of a concentration ratio. is the concentration ratio in a monoplistically competitive industry likely to be higher than for a perfectly competitive industry?

  • Q : Estimation of total cost in specific

    Total cost can be estimated as area: (i) 0bcq1. (ii) 0adq2. (iii) 0Peq2. (iv) aPed. (v) Cannot be measured in illustrated figure. 22</span></p>
                                        </div>
                                        <!-- /comment-box -->
                                    </li>
   
   </td>
	</tr><tr>
		<td>
       
      <li>
                                        <div class=

    Q : Demonstrates the Lorenz Curve This

    This given figure demonstrates as: (w) Lorenz curve. (x) familial income distribution graph. (y) Gini curve. (z) Blanc income standard curve. </span></p>
                                        </div>
                                        <!-- /comment-box -->
                                    </li>
   
   </td>
	</tr><tr>
		<td>
       
      <li>
                                        <div class=

    Q : Expectations in market demands for

    Present market demands for most of the durable goods tend to rise if: (1) Their prices are predicted to rise in the near future. (2) Consumers expect growth in supplies of substitutes. (3) Technological advances make present models obsolete. (4) The p

  • Q : Positively sloped resource supply curves

    When the resource supply curves of facing a competitive industry are positively sloped, in that case the exit of firms which have incurred losses will result within: (w) higher prices and lower output by each firm, and higher average production costs.

  • Q : Output level of profit maximizing of

    The profit maximizing competitive firm in illustrated graph will: (i) produce output level q5. (ii) minimize total costs by producing output level q3. (iii) experience fixed costs equal to 0P3fq4. (iv) produce output level q4. (v) inevitably experienc