--%>

Problem related to rising GDP

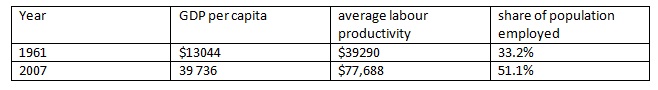
Between 1961 and 2007, the rising share of the Canadian population in paid employment contributed to rising GDP per person. But suppose that the share of the Canadian population in paid employment had remained constant between 1961 and 2007. What would Canadian GDP per person have been in 2007? Make use of the relevant data from the following table:

610_GDP.jpg

E

Expert

Verified

In 1961 the average labour productivity was $39290 and the 33.2% of the population was employed. GDP per capita can be calculated by average labour productivity x % of population employed, ie $ 39290 x 33.2% = $ 13044 as given in the table.

Similarly the value of the GDP per capita in 2007 was calculated as $39736

If however, in 2007, the average labour productivity was $77688 and the share of population employed was 33.2%, the GDP per capita would be $ 77688 x 33.2% = $25792

   Related Questions in Macroeconomics

  • Q : Which things are concerned with

    Macroeconomics is mainly concerned along with all things as the: (i) decisions individuals and firms make while prices change. (ii) resource usage and technology bases of firms. (iii) levels of national employment and income. (iv) movements within the

  • Q : Explain growth accounting. Economic

    Economic growth is measured by the rate of increase in national output, GDP. The output depends on inputs -labour, capital technology etc. the theories of economic growth bring out how and to what extent each input or factor contributes to the g

  • Q : Functions of central bank Describe

    Describe functions of central bank? Answer: (A) Issue of currency: Central bank is the only authority for the issue of currency

  • Q : Fiscal and monetary policies in

    Explain the impact of changes in fiscal and monetary policies in curtailing inflation?

  • Q : Define law of supply Law of supply : It

    Law of supply: It is the claim which, other things equivalent, the quantity supplied of a good increases whenever the price of the good increases.

  • Q : Potential GDP The hypothetical

    The hypothetical information in the following table shows what the economic situation will be in 2015 if the Fed does not use monetary policy: Year Potential GDP Real GDP Price Level 2014 $15.2 trillion $15.2 trillion 110.0 2015 $15.6 trillion $15.8 trillion

  • Q : How central bank reduce the

    Describe any two measures by which a Central Bank can attempt to decrease the gap. Answer: Central bank can decrease this gap by adopting two measures illustrated b

  • Q : Public debt How does an internally held

    How does an internally held public debt differ from an externally held public debt?

  • Q : IS-KM Model with classical supply

    discuss with the help of IS-LM model why money has no effect on output in classical supply case

  • Q : Marginal utility of good at its maximum

    Can someone help me in finding out the right answer from the given options. The consumer maximizes utility whenever the spending patterns cause: (1) Marginal utility of each and every good to be at its maximum value. (2) Marginal utilities of each and every goods cons