--%>

Problem on utility funtion probability

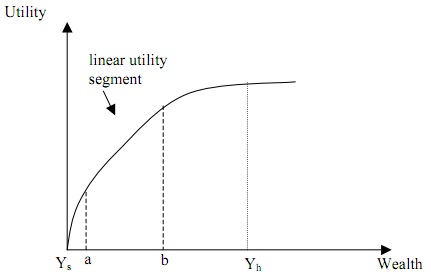
Suppose that your utility, U, is a function only of wealth, Y, and that U(Y) is as drawn below. In this graph, note that U(Y) increases linearly between points a and b. 

Suppose further that you do not know whether or not you will be sick, but you do know that the probability of becoming sick is p (while the probability of staying healthy is 1-p).  If you do get sick, your wealth will be Ys = 0.  If you do not get sick, your wealth will be Yh > 0. 

1940_utility function.jpg

(1) Write an expression for expected income, EI, and an expression for expected utility without insurance.
 
(2) Assume that a < EI < b.  Draw, on the graph above, a line showing expected utility without insurance. Also draw a line showing expected utility with actuarially fair full insurance.

(3) Consider an actuarially fair partial insurance contract that offers a if you are sick and b if you are healthy. Would your utility with such a contract be greater or less than your utility with an actuarially fair full insurance contract? Briefly, explain. 

   Related Questions in Advanced Statistics

  • Q : Null hypothesis In testing the null

    In testing the null hypothesis H0: P=0.6 vs the alternative H1 : P < 0.6 for a binomial model b(n,p), the rejection region of a test has the structure X ≤ c, where X is the number of successes in n trials. For each of the following tests, d

  • Q : Bayesian Point Estimation What are the

    What are the Bayesian Point of estimation and what are the process of inference in Bayesian statistics?

  • Q : Error probability As of last year, only

    As of last year, only 20% of the employees in an organization used public transportation to commute to and from work. To determine if a recent campaign encouraging the use of public transportation has been effective, a random sample of 25 employees is to be interviewe

  • Q : Problem on layout A manufacturing

    A manufacturing facility consists of five departments, 1, 2, 3, 4, and 5. It produces four components having manufacturing product routings and production volumes indicated below.   1. Generate the from-to matrix and the interaction matrix. Use a

  • Q : Calculate corresponding t value or s

    1)    Construct a 99% confidence interval for the population mean µ.   2)    At what significance level do the data provide good evidence that the average body temperature is

  • Q : Components of time series Name and

    Name and elaborate the four components of time series in brief.

  • Q : Problem on Poisson distribution The

    The number of trucks coming to a certain warehouse each day follows the Poisson distribution with λ= 8. The warehouse can handle a maximum of 12 trucks a day. What is the probability that on a given day one or more trucks have to be sent away? Round the answer

  • Q : Non-parametric test what is the

    what is the appropriate non-parametric counterpart for the independent sample t test?

  • Q : Find the cumulative distribution

    You must use the pre-formatted cover sheet when you hand in the assignment. Out full detailed solutions. Sloppy work will naturally receive a lower score. 1. Suppose at each step, a particle moving on sites labelled by integer has three choices: move one site to the right with pro

  • Q : Probability of winning game Monte Carlo

    Monte Carlo Simulation for Determining Probabilities 1. Determining the probability of winning at the game of craps is difficult to solve analytically. We will assume you are playing the `Pass Line.'  So here is how the game is played: The shooter rolls a pair of