Problem on tax system
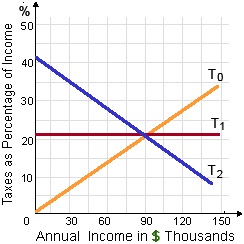
In the figure shown below, line T0 depicts a tax system which is: (1) Progressive. (2) Regressive. (3) Proportional. (4) Unbiased. (5) Recessive. Please someone suggest me the right answer.
In the figure shown below, line T0 depicts a tax system which is: (1) Progressive. (2) Regressive. (3) Proportional. (4) Unbiased. (5) Recessive.
Please someone suggest me the right answer.
what can be the minimum value of investment multiplier?
(a) Do you think that macroeconomic policy should be designed to achieve a measured unemployment rate of zero?
Ideas in which organization is involved: Talking about the growth of any company. There are basically three type of broad ideas in which management of any organization is involved. These are: 1. Corporate Strategy<
Hey friends i need your support for justify the problem that is given below: If the United Auto Workers Union acquires benefit package and a large wage from GM, Ford, and Chrysler which increases the cost of U.S. cars, it is a
Can someone help me in finding out the right answer from the given options. The substitution effect is fully explained when: (i) Brandon just eat tofu since he is on a diet. (ii) A rise in the price of corn chips drives up demand for the salsa. (iii)
The basic determinant of the transactions demand for money is the
Define fiscal policy? Answer: Fiscal policy is the revenue and expenditure policy of government with a view to combat the state of inflationary or deflationary gap
What are the four methods that FED can use to make money? What are the most powerful one and what technique the FED to create a gradual easing of the money supply either created or destroyed most seldom uses?
Describe functions of central bank? Answer: (A) Issue of currency: Central bank is the only authority for the issue of currency
Explain with examples the reasons for exceptional demand curve
18,76,764
1958199 Asked
3,689
Active Tutors
1413553
Questions Answered
Start Excelling in your courses, Ask an Expert and get answers for your homework and assignments!!