--%>

Problem on queuing diagram

Draw a queuing diagram for the systems below and describe them using Kendall’s notation:

A) Single CPU system

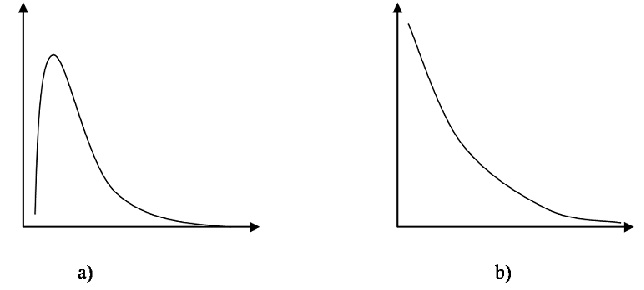
B) 4 CPU system, where the arrival times are distributed according to fig a and the service times according to fig b. Requests are serviced according to priorities, with higher priority request pre-empting lower priority ones.

C) A system comprising three web servers, to which requests are randomly directed. Each of the servers contains two CPUs.

2098_curve.jpg

   Related Questions in Basic Statistics

  • Q : Homework help on Human memory & SPSS

    Effect of Scopolamine on Human Memory: A Completely Randomized Three Treamtent Design (N = 28) Scopolamine is a sedative used to induce sle

  • Q : Networks of queues Networks of queues •

    Networks of queues • Typically, the flow of customers/request through a system may involve a number of different processing nodes.– IP packets through a computer network– Orders through a manufactur

  • Q : Computing Average revenue using

    Can anyone help me in the illustrated problem? The airport branch of a car rental company maintains a fleet of 50 SUVs. The inter-arrival time between the requests for an SUV is 2.4 hrs, on an average, with a standard deviation of 2.4 hrs. There is no indication of a

  • Q : Creating Grouped Frequency Distribution

    Creating Grouped Frequency Distribution: A) At first we have to determine the biggest and smallest values. B) Then we have to Calculate the Range = Maximum - Minimum C) Choose the number of classes wished for. This is generally between 5 to 20. D) Find out the class width by dividing the range b

  • Q : Compare the test results The grade

    The grade point averages of 61 students who completed a college course in financial accounting have a standard deviation of .790. The grade point averages of 17 students who dropped out of the same course have a standard deviation of .940. Do the data indicate a

  • Q : Average think time Software monitor

    Software monitor data for an interactive system shows a CPU utilization of 75%, a 3 second CPU service demand, a response time of 15 seconds, and 10 active users. Determine the average think time of these users?

  • Q : Write out the null hypothesis 1.

    1. (AAC/ACA c9q1).  For each of the following studies, decide whether you can reject the null hypothesis that the groups come from identical populations. Use the alpha = .05 level.1a.

  • Q : Calculate the p- value Medical tests

    Medical tests were conducted to learn about drug-resistant tuberculosis. Of 284 cases tested in New Jersey, 18 were found to be drug- resistant. Of 536 cases tested in Texas, 10 were found to be drugresistant. Do these data indicate that New Jersey has a statisti

  • Q : Spss in Business and Management Please

    Please tell me the cost of this current assignment. Note : I do not want the Solutions but please tell me the price as the assignment is .. Is the cost 3 euro? Do you sell those questions?

  • Q : STATISTICS Question This week you will

    This week you will analyze if women drink more sodas than men.  For the purposes of this Question, assume that in the past there has been no difference.  However, you have seen lots of women drinking sodas the past few months.  You will perform a hypothesis test to determine if women now drink more

  • ©TutorsGlobe All rights reserved 2022-2023.