--%>

Problem on perfect replacements

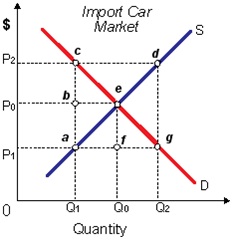
Imports and American cars are much close however not perfect replacements. When the U.S. govt. tried to enhance American car sales by setting a price ceiling of P1 on imported cars: (i) The quantity of cars imported will drop/fall from Q0 to Q1. (ii) American car prices would increase to P2. (iii) Foreign car exporters would ship much luxury cars to the United States. (iv) American made car sales would increase by Q2 to Q0.
1763_4.jpg

Can someone help me in getting through this problem.

   Related Questions in Macroeconomics

  • Q : Cost-push inflation Describe cost-push

    Describe cost-push inflation and its major source.

  • Q : Calculating National Income Let suppose

    Let suppose NDPFC is Rs. 1,000 crores, and NFA is Rs. (--) 5crores, then what will be national income (NNPFC)? Answer: NNPFC = NDPFC+NFA = 1000 + (-5) = Rs. 995 crores.

  • Q : Why government taken as capital receipt

    Why the borrowings by Government are taken as capital receipts?

  • Q : Self consumption-Value of output

    Illustrate whether output generated for self consumption is comprised or not comprised in the value of output? Answer: The output generated for self consumption is

  • Q : Demand curves when longer periods are

    Whenever longer periods are considered and hence bigger ranges of adjustments (that is, substitutions) become probable, demand curves tend to become: (i) Flatter, and therefore do supply curves. (ii) Flatter, as supply curves become steeper. (iii) Ste

  • Q : Unemployment (a) Do you think that

    (a) Do you think that macroeconomic policy should be designed to achieve a measured unemployment rate of zero?

  • Q : Supply factors in economic growth

    Briefly explain the four supply factors in economic growth?

  • Q : Internet technology in airline

    Speculate regarding the behavior which could result from Internet technology in airline transactions and propose 2 or more strategies to deal with them.

  • Q : Consumer Surplus and Producer Surplus

    In a graph of competitive market in equilibrium, the net surpluses producers and consumers enjoy generally equivalents the area among the: (i) Demand and supply curve however to the left of point of the market equilibrium. (ii) Horizontal axis and a 45°line origin

  • Q : POSSIBILITIES Possibilities Food

    Possibilities Food (millions of tons per year) Tractors (millions per year) A 0 30 B 4 28 C 8 24 D 12 20 E 16 14 F 20 8 G 24 0 a. Is it possible for this nation to produce thirty million tons of food per year? Why or why not. b. Is it possible for this nation to produce thirty million