--%>

Problem on money diagram

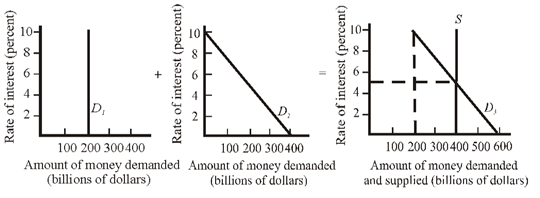
Help me to go through this problem. Refer to the given market for money diagrams. If the interest rate was at 8 percent, people would: A) sell bonds, which would cause bond prices to fall and the interest rate to fall. B) buy bonds, which would cause bond prices to rise and the interest rate to fall. C) have insufficient liquidity, which would cause them to reduce their spending on consumer goods. D) buy bonds, which would cause bond prices to fall and the interest rate to rise.

1582_6.png

   Related Questions in Microeconomics

  • Q : Problem regarding marginal factor cost

    In equilibrium for any of profit-maximizing firm, marginal revenue product of the labor: (i) Is equivalent to the change in net revenue related with selling an extra unit of output. (ii) Surpasses the wage rate by maximum possible. (iii) Equivalents marginal factor co

  • Q : History of Labor Union problem Can

    Can someone help me in finding out the right answer from the given options. Working time gone in strikes as the percent of net working time in the United States since from the end of World War II has: (1) Rose to around 20 percent. (2) Reduced to a bit over 6 percent.

  • Q : Labor adds uniformly to total revenue

    The entire profit maximizing firm will appoint more labor up to the point where: (i) Average physical product of the labor equivalents the nominal wage. (ii) Last unit of the labor adds up equally to net revenue and net cost. (iii) Marginal product of the labor is at

  • Q : Supply curves toward right from

    Technological progress shift: (i) Demand curves up and to right. (ii) Production possibilities curve in the direction of their origins. (iii) Prices into inflationary spiral. (iv) Supply curves rightward from vertical axis. Can som

  • Q : Elasticity of demand as price-total

    Increasing the price of a product definitely raises total revenue when the elasticity of demand is as: (w) infinity. (x) unitary. (y) relatively elastic. (z) relatively inelastic.

  • Q : Problem on demand curve shifting right

    Can someone help me in finding out the right answer from the given options. Soybean farming is very much competitive, and United States is the major producer. The soybean mold carried on kangaroo rat fur devastates this year’s crop. This blight is eventually lea

  • Q : Resource of supply curve The resource

    The resource probably to conform to the supply curve demonstrated in this figure would be: (1) housing. (2) capital. (3) labor. (4) land. (5) entrepreneurship.

    Q : Relationship between APP-MPP If APP is

    If APP is at its maximum, then what is the relationship among MPP and APP? Answer: MPP = APP

  • Q : Limits to statistical method Limits to

    Limits to statistical method: The mechanics of generating data and undertaking statistical analysis and modeling with that data are relatively straightforward. What is less clear is the process of structuring the scope and content of an empirical stud

  • Q : Affect of total utility to marginal

    Whenever total utility is at a maximum, then marginal utility is: (1) Rising. (2) Reducing. (3) Zero. (4) Similar as total utility. Can someone help me in getting through this problem.