Problem on equilibrium price
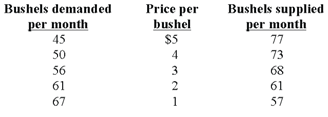
Refer to the following data. Equilibrium price will be: A) $4. B) $3. C) $2. D) $1. Give the answer of above questaion
Refer to the following data. Equilibrium price will be: A) $4. B) $3. C) $2. D) $1.
Give the answer of above questaion
The profit maximizing competitive firm in illustrated graph will: (i) produce output level q5. (ii) minimize total costs by producing output level q3. (iii) experience fixed costs equal to 0P3fq4. (iv) produce output level q4. (v) inevitably experienc
Airlines considerably decreased the number of flights accessible in the year 2005, as compared to flight availability during the year 2000. Passenger mileage was fall. Economists would be least possible to ascribe the decline in airline ticket sales throughout the ear
For a purely competitive industry in the long-run: (w) neither net entry nor net exit of firms will arise. (x) firms will experience significant economies of scale. (y) the typical firm’s economic profit will exceed its accounting profit. (z) th
Of the given firms, the best illustration of a natural monopoly is: (i) Dell, the largest seller of personal computers. (ii) Toyota, i.e., the huge car company in the world. (iii) OPEC, i.e., the international oil cartel. (iv) Google that dominates th
A nondiscriminating unregulated monopolist maximizes profit by: (w) charging the highest price the market will bear. (x) often changing designs and building in planned obsolescence. (y) setting marginal costs equal to marginal revenue [MC = MR]. (z) s
Can someone help me in finding out the most precise answer from the given options. The long run in the production theory is a period just long sufficient for: (i) Firms to totally differ all resources. (ii) Profits to be maximized. (iii) Marginal costs curves to be re
All currency issued by central bank is its monetary liability. Explain how? Answer: The Central Bank is grateful to back the currency with assets of equivalent valu
Tax: It is a compulsory payment prepared by household and firm to government.
When your firm generates ski boats, your net revenues from selling given numbers of ski boats would be influenced least by: (1) Raised prices for jet skis. (2) Pay hikes for dock-workers. (3) Government increasing fees for boat licenses. (4) Vacatione
I have a problem in economics on Power of monopsonist. Please help me in the given question. The firm which is the sole buyer of a specific good or resource is a: (i) Monopsonist. (ii) Plutocracy. (iii) Bilateral monopolist. (iv) Price discriminator.
18,76,764
1935621 Asked
3,689
Active Tutors
1422536
Questions Answered
Start Excelling in your courses, Ask an Expert and get answers for your homework and assignments!!