--%>

Problem based on production possibilities curve

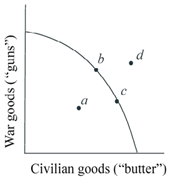
Refer to the given production possibilities curve and give  answer of following question . At the onset of the Second World War the Soviet Union was already at full employment. Its economic adjustment from peacetime to wartime can best be described by the movement from point: A) c to point b. B) b to point c. C) a to point b. D) c to point d.

928_6.png

Some one help me in getting out from above question

   Related Questions in Microeconomics

  • Q : Example of Signaling As interviewing

    As interviewing for the job as a bill collector for loan shark, Bob states his degree in the martial arts from Hard Knox Reformatory, his summer internship by BreakUrLegs, Inc., and his family connections. Bob’s casual discussion of such credentials is an illust

  • Q : Marginal Utilities and Demand Prices

    Can someone help me in finding out the right answer from the given options. Rational individual consumers tend to purchase goods until the relative market prices for each and every goods purchased are proportional to all individuals: (i) Cost or benefit ratio. (ii) Op

  • Q : Words of Joseph A. Schumpeter about

    According to Joseph A. Schumpeter as: (1) refined and popularized the idea that profits derive by innovation. (2) perceived profits as rewards for bearing uncertainty. (3) believed which monopoly firms are so inefficient which none fully realize their

  • Q : Farm maximizes profit of producing at

    When the wholesale price P = $3 per dozen increased, this purely competitive increased farm maximizes profit with producing ___ dozen increased at a total (loss or profit) of $___. (i) zero; loss; $2000. (ii) 2000; loss; $1500. (iii)

  • Q : Sum of Monopolistic Exploitation Sum of

    Sum of the monopolistic exploitation across all workers tends to rise however a firm as well functions at a more socially and economically proficient level of output and employment whenever the firm is capable to engage in: (1) Blacklisting in its dea

  • Q : Measurement of cross-elasticity of

    The cross-elasticity of demand measures as: (1) the changes in quantities sold when the price of related good changes. (2) changes within the prices of substitute goods. (3) changes within the prices of complementary goods. (4) how quantities sold cha

  • Q : Technology in supply I have a problem

    I have a problem in economics on Technology in supply. Please help me in the following question. The bumper corn crop caused by the good weather would symbolize a raise in: (i) supply. (ii) Consumer’s tastes for corn. (iii) Demand. (iv) The price of corn. <

  • Q : Find out marginal cost curve

    LoCalLoCarbo has turn into the favorite of fad dieters. Therefore in illustrated figure there curve C shows: (1) LoCalLoCarbo’s marginal cost curve. (2) LoCalLoCarbo’s average variable cost curve. (3) LoCalLoCarbo’s average total cost curve. (4) the

  • Q : Kinked demand curve for an oligopoly A

    A kinked demand curve for an oligopoly is probably when: (1) all the rival firms face identical demand curves. (2) rival firms are expected to match price cuts, but not price hikes. (3) firms ignore their rivals’ strategies when

  • Q : Average revenue and marginal revenue

    In spite of of the amount sold, price equals for a price-taker firm on both average: (i) revenue and marginal revenue. (ii) variable cost and marginal cost. (iii) fixed cost and average variable cost. (iv) total cost and marginal revenue.