Price increment in elasticity
A price hike $4 to $5 per slice of pizza because of total revenue to: (w) fall. (x) remain constant. (y) rise. (z) this is not possible to tell from such data. How can I solve my economics problem? Please suggest me the correct answer.
A price hike $4 to $5 per slice of pizza because of total revenue to: (w) fall. (x) remain constant. (y) rise. (z) this is not possible to tell from such data.
How can I solve my economics problem? Please suggest me the correct answer.
Assets turn into less desirable to prospective financial investors while: (w) they become more liquid. (x) interest rates increase. (y) their prices go up. (z) default risks decrease. How can I solve my Eco
Whenever kids abandon a short-lived fad for Dinosaur action figures, this would be exhibited by the: (1) Left-ward shift of demand curve. (2) Right-ward shift of supply curve. (3) Right-ward shift of demand curve. (4) Left-ward shift of supply curve. (5) Movement down
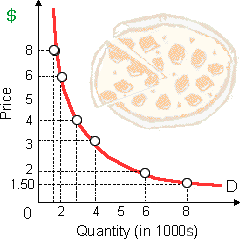
Price hikes for DVD games will boost total revenue providing the price is: (w) located on this demand curve. (x) above $30. (y) below $30. (z) below $25. Q : Marginal Utilities and Demand Prices Can someone help me in finding out the right answer from the given options. Rational individual consumers tend to purchase goods until the relative market prices for each and every goods purchased are proportional to all individuals: (i) Cost or benefit ratio. (ii) Op
Can someone help me in finding out the right answer from the given options. Rational individual consumers tend to purchase goods until the relative market prices for each and every goods purchased are proportional to all individuals: (i) Cost or benefit ratio. (ii) Op
If one industry’s development stimulates development in support and complementary industries, it permits firms within the industry to: (i) move up their rising long run average costs curves. (ii) sell their products for higher prices. (iii) focus old technologie
Provide the solution of this question. The problem of asymmetric information is that: A) neither health care buyers nor providers are well-informed. B) health care providers are well-informed, but buyers are not. C) the outcomes of many complex medical procedures cannot be predicted. D) insurance co
If a monopolist’s marginal revenue is zero, then: (1) total revenue is zero. (2) demand is perfectly inelastic. (3) the price of the product exceeds average cost. (4) economic profit is zero. (5) total revenue is maximized. Q : Problem regarding Rational Ignorance Whenever decision makers select not to pursue further information as the expected reward for the searching for it does not surpass its expected cost, the outcome is: (1) Adverse choice. (2) Consumer exploitation. (3) Unintended effects. (4) Asymmetric information. (5)
Whenever decision makers select not to pursue further information as the expected reward for the searching for it does not surpass its expected cost, the outcome is: (1) Adverse choice. (2) Consumer exploitation. (3) Unintended effects. (4) Asymmetric information. (5)
Salespeople as illustrated in graph who earn percentage commissions upon the total revenue from DVD games would create their highest incomes at specific price of: (w) $50. (x) $25. (y) $10. (z) zero. Q : Ex-ante investment Ex-ante investment : Ex-ante investment: This is planned or desired investment throughout a specific period.
Ex-ante investment: This is planned or desired investment throughout a specific period.
18,76,764
1947013 Asked
3,689
Active Tutors
1451854
Questions Answered
Start Excelling in your courses, Ask an Expert and get answers for your homework and assignments!!