--%>

Price elasticity of demand coefficient

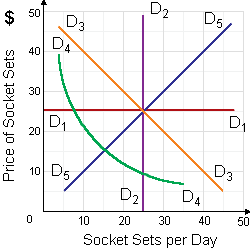
In this demonstrated figure, there the price elasticity of demand coefficient is: (1) one at the midpoint. (2) greater than one in range a. (3) less than one in range b. (4) falling along with movements down along the demand curve. (5) All of the above.

1771_Price Elasticity of Demand.png

How can I solve my Economics problem? Please suggest me the correct answer.

   Related Questions in Microeconomics

  • Q : Income elasticity of positive and

    This given figure as in below demonstrates how consumption of goods A, B, C and D varies like a family’s income changes. Since income rises, the income elasticity of demand is positive and increasing for: (w) good A. (x) good B  (y) good C.

  • Q : Problem on marginal resource cost Can

    Can someone help me in finding out the right answer from the given options. Despite of the market structures, the firms maximize gain by hiring labor where the: (i) Marginal revenue product = marginal resource cost. (ii) Marginal r

  • Q : Break-even level of income under

    For a family of four the break-even level of income under the negative income tax system demonstrated in this figure is: (1) $15,000 per year. (2) $30,000 per year. (3) $45,000 per year. (4) $60,000 per year. (5) $75,000 per year.

  • Q : Share of wages problem Can someone

    Can someone please help me in finding out the accurate answer from the following question. The elasticity of demand for the labor tends to rise as there are increases in the: (i) Amount of capital utilized in a production procedure. (ii) Rate of automation in industry

  • Q : Aggregate effective demand Why,

    Why, according to Keynes, is investment the key economic variable? Why does he think that the volatility of investment spending is likely to cause a problem of aggregate effective demand? Why does he think that this problem can only be solved by government interventio

  • Q : Marginal Revenue and Costs in purely

    Hey friends I need your suggestion for this query about the profit and losses as illustrated graph when this firm produces q2 output, in that case its: (w) MR > MC. (x) MR < MC. (y) MR = MC. (z) P > MC.Please give me right answer for the same.

  • Q : Monopsony Power- Labors Immobility I

    I have a problem in economics on Monopsony Power and Immobility of Labor. Please help me in the given question. The immobility of labor is economically significant as: (w) Most of the people like to move, however can't. (x) People in high salary occupations won't be c

  • Q : Price discrimination in markets Price

    Price discrimination is probably in markets: (w) for medical services. (x) for wheat sold by farmers. (y) for bread sold by grocers. (z) where all consumers have identical demand curves. Can anybody suggest me the

  • Q : Determining Substitution products When

    When a price hike for Big Gulps of GlugaChug from $1 to $2 improves sales of dehydrated water from 50 to 100 kegs, then the dehydrated water and GlugaChug are: (1) Joint outputs in the production. (2) Complements. (3) Substitutes. (4) Mixed resource alternatives.

  • Q : Illustrations of monopoly power The

    The best illustrations of monopoly power in the United States are possibly: (w) local public utility companies. (x) state university systems. (y) the national TV networks. (z) national defense firms. Hey friends pl