--%>

Pretax -posttax and transfer distribution of income

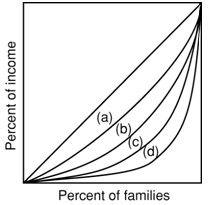
Refer to the following diagram. If line b represents the pretax and transfer distribution of income in the United States, we would expect the post-tax and transfer distribution to be: A) line a. B) line b, because taxes and transfers have no effect on income distribution. C) line c. D) line d.

2343_vs.png

Help me to get through this problem.

   Related Questions in Microeconomics

  • Q : Price elasticity and market power The

    The price elasticity of demand equals one when this firm produces where total revenue is: (i) $72,000 per period. (ii) $80,000 per period. (iii) $96,000 per period. (iv) $100,000 per period. (v) $144,000 per period.

    Q : Nondiscriminating monopoly Tell answer

    Tell answer of this question.Refer to the following data for a nondiscriminating monopolist. At its profit-maximizing output, this firm will be operating in the: 1) perfectly elastic portion of its demand curve. 2) perfectly inelastic portion of its demand curve. 3)

  • Q : Farm employment Over the past several

    Over the past several decades, farm employment has: A) grown absolutely, but declined as a percentage of total employment. B) declined both absolutely and as a percentage of total employment. C) increased both absolutely and as a percentage of total employment. D) dec

  • Q : Features of Indifference Curve Describe

    Describe the features of Indifference Curve? Answer: A) Indifference curves slopes downward from left to right.B) Indifference curves are Convex to origin. C) Two Indifference curve not at all intersect

  • Q : Accounting profits when economic profit

    Whenever economic profit equivalents zero, then the accounting profits: (i) Are explicit costs of the remaining in business. (ii) Will induce raised investment even when accounting costs are much low. (iii) Are too zero. (iv) Reflect normal returns on the investment t

  • Q : Labor Unions and Employment The labor

    The labor union will not enhance its members' job viewpoints by: (1) Raising worker productivity through apprenticeship. (2) Limiting entry through quotas or high initiation fees. (3) Lobbying for the tariffs on competing the foreign goods. (4) Collectively bargaining

  • Q : Short-run supply curve of a competitive

    At any point on short-run supply curve of a competitive industry, every firm produces at the similar: (w) rate of technological equilibrium. (x) average cost. (y) marginal cost. (z) positive level of economic profit.

    Q : Advertising for higher prices Brand

    Brand name aspirin sells on higher prices than generic aspirin since: (w) higher prices mean higher quality. (x) they are chemically superior. (y) they cost more to produce. (z) advertising campaigns relate the brand name along with quality.

  • Q : Setting a price in profit-maximizing

    This profit-maximizing firm as in demonstrated figure will set a price where: (1) P > MC = MR. (2) MR > MC = P. (3) MR = P > MC. (4) MR = P > MC. (5) P < MC < MR.

    Q : Price elasticity of supply when demand

    When increased demand causes the price of main beluga caviar to climb from $2750 to $3250 per pound and consequently world production rises from 24 to 40 tons yearly, its caviar has a price elasticity of supply approx