--%>

Pearsons correlation coefficient

The table below illustrates the relationship between two variable X and Y.

2432_pearson.jpg

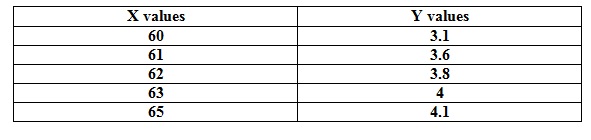
A) Draw the scatter diagram representing the data.

B) Calculate the Pearsons correlation coefficient.

C) Determine the linear regression equation.

Use your equation to predict the Y value for an X value of 66.

   Related Questions in Advanced Statistics

  • Q : Error probability As of last year, only

    As of last year, only 20% of the employees in an organization used public transportation to commute to and from work. To determine if a recent campaign encouraging the use of public transportation has been effective, a random sample of 25 employees is to be interviewe

  • Q : Probability on expected number of days

    It doesn't rain often in Tucson. Yet, when it does, I want to be prepared. I have 2 umbrellas at home and 1 umbrella in my office. Before I leave my house, I check if it is raining. If it is, I take one of the umbrellas with me to work, where I would leave it. When I

  • Q : Probability Distributions and Data

    1. A popular resort hotel has 300 rooms and is usually fully booked. About 4% of the time a reservation is canceled before 6:00 p.m. deadline with no penalty. What is the probability that at least 280 rooms will be occupied? Use binomial distribution to find the exact value and the normal approxi

  • Q : Use the law of iterated expectation to

    Suppose we have a stick of length L. We break it once at some point X _

    Q : Non-parametric test what is the

    what is the appropriate non-parametric counterpart for the independent sample t test?

  • Q : Problem on Chebyshevs theorem 1. Prove

    1. Prove that the law of iterated expectations for continuous random variables.2. Prove that the bounds in Chebyshev's theorem cannot be improved upon. I.e., provide a distribution which satisfies the bounds exactly for k ≥1, show that it satisfies the

  • Q : Problem on utility funtion probability

    Suppose that your utility, U, is a function only of wealth, Y, and that U(Y) is as drawn below. In this graph, note that U(Y) increases linearly between points a and b.  Suppose further that you do not know whether or not you

  • Q : Problem on layout A manufacturing

    A manufacturing facility consists of five departments, 1, 2, 3, 4, and 5. It produces four components having manufacturing product routings and production volumes indicated below.   1. Generate the from-to matrix and the interaction matrix. Use a

  • Q : Probability of winning game Monte Carlo

    Monte Carlo Simulation for Determining Probabilities 1. Determining the probability of winning at the game of craps is difficult to solve analytically. We will assume you are playing the `Pass Line.'  So here is how the game is played: The shooter rolls a pair of

  • Q : Describe what happens to the confidence

     A nurse practitioner working in a dermatology clinic is studying the efficacy of tretinoin in treating women's post partum abdominal stretch marks.  From a sample of 15 women, the mean reduction of stretch mark score is -0.33 with a sample standard deviation of 2.46.  Describe wha