--%>

Order Quantity-Cycle Inventory-Safety Inventory

Consider the following data pertaining to a distribution center.

2446_distribution centre.jpg

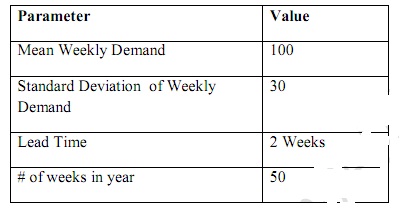
Ordering cost: $50 /order
Holding cost: $4 /unit /week.
Cycle service level: 97%

Summary:

The question is related to cost accounting in finance. It deals with measures such as Order Quantity, Cycle Inventory, Safety Inventory, Reorder Level, Annual Inventory Holding, Annual Ordering Cost, etc. All these measures are calculated according to given cost and time.

E

Expert

Verified

Consider the following data pertaining to a distribution center.

Mean Weekly Demand(d): 100
Standard Deviation  of Weekly Demand(Sd): 30
Lead Time(L): 2 Weeks
No. of weeks in year: 50


Ordering cost (Cp): $50 /order
Holding cost (Ch): $4 /unit /week.
Cycle service level: 97%  
Z – value for service level 97 % = 1.89
Annual demand (D) = d * No. of weeks = 100 * 50 = 5000 units
Standard deviation of weekly demand during lead time =SL = sqrt( sum of squares of ‘Sd’ during the ‘L’ number of weeks) = sqrt( 302 + 302) = 42.42 units

Order Quantity = Q = sqrt( (2 * D * Cp)/Ch) 
              = sqrt((2* 5000 * 50)/4)
              = 353.55 units
              =354 units approx

Cycle inventory = Q/2 
    = 353.55/2 
    = 176.775 units
    = 177 units approx

Safety inventory = z* SL 
     = 1.89 * 42.42 
    = 80.18 units
    = 80 units approx

Re-Order Level = d*L + z* SL
     = 100*2 + 1.89*42.42
    = 280 units approx

Annual Inv Holding Cost = (Q/2)*Ch
      = 353.55/2 * 4
      = $ 707 approx

number of orders per year
= D/Q
= 5000/353.55
=14.14

Annual ordering cost = (D/Q) * Cp
              = 5000/353.55 * 50
              =$ 707 approx

   Related Questions in Finance Basics

  • Q : Frequency Distribution What is

    What is Frequency Distribution? Compare Categorical Frequency Distribution, Ungrouped Frequency Distribution, Grouped Frequency Distribution?

  • Q : Explain 3-year Expenditures and

    3-year Expenditures and Positions: The display at the beginning of each departmental budget which presents the different departmental programs by title, dollar totals, places, and source of funds for the past, current, and budget years.

  • Q : Difference among proforma financial

    Describe difference among pro forma financial statements and a cash budget? Depict why pro forma financial statements are not utilized to forecast cash needs. Pro forma income statements deal along with revenues and expenses which are not alway

  • Q : Determine the new per unit cost of

    Normal 0 false false

  • Q : Describe the Hirfindahl-Hirschman Index

    Describe the Hirfindahl-Hirschman Index?The Hirfindahl-Hirschman Index, or HHI, is the standard measure employed by economists to evaluate market concentration. The greater the level of concentration amongst competitors, the higher the HHI. The

  • Q : Distinguish among refinancing debt and

    Normal 0 false false

  • Q : Effect of bank charges discount

    What happens while a bank charges discount interest on a loan? While a bank charges discount interest on a loan the required interest payment is subtracted through the loan proceeds at the time the loan is made. It makes the effective interest

  • Q : Describe the bird in the hand theory of

    Describe the bird in the hand theory of cash dividends. The bird in the hand dividends theory says that dividends attained now are better than a promise of future dividends. Uncertainty is resolved while a dividend is paid.

  • Q : What are A-pages A-pages : An ordinary

    A-pages: An ordinary reference to the Governor's Budget synopsis. The Budget highlights now contained in the Governor's Budget synopsis were just once contained in front of the Governor's Budget on pages A-1, A-2, and so on, and were,

  • Q : Increased common stock cash dividend

    Do you trust an increased common stock cash dividend can send any signal to the common stockholders? If so, what signal might it send? An increase in cash dividends is frequently seen as a positive signal. A company would be unlikely to raise