SIGNALS AND SYSTEM / BENT 2143: network analysis
ASSIGNMENT
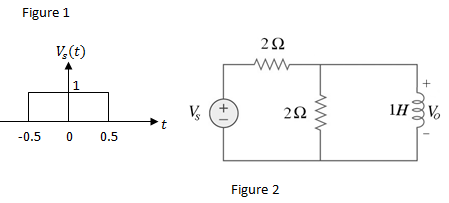
Consider a rectangular pulse signal shown in Figure 1 and a system shown in Figure 2.
Calculation:
1. Represent the signal in Figure 1 in terms of Fourier transform.
2. Find the transfer function H(w) = V0(w)/vs(w) for the system in Figure 2.
3. If the signal in Figure 1 is applied to the system in Figure 2, determine the output voltage v0(t).
Simulation in MATLAB:
4. Plot the amplitude and phase spectra of the signal in Figure 1 for frequency limit between 0.1 to 100 radians/seconds using 1000 samples. Appropriately label and title the resulting spectra.
5. Similarly, plot the amplitude and phase spectra of the transfer function for the system in Figure 2. Use the same frequency limit and the same number of samples as in Step 4. Appropriately label and title the resulting spectra.
6. Finally, plot the amplitude and phase spectra of the output voltage v0(t) using similar frequency limit and number of samples. Appropriately label and title the resulting spectra.
Hints for simulation:
- You need to assign empty array for amplitude and phase arrays respectively (initialization).
- Use 'abs' and 'angle' command to calculate the magnitude and angle parameters.
- Use 'plot' command to plot the spectra and use 'subplot' to plot both spectrums in one figure.
Assignment Guidelines:
1. Report format: Table of Contents, Objectives, Theory, Results (calculations, coding and figures), Discussion, Conclusion and References.
2. Report must be typed using Calibri (size 11), 1.15 line spacing and use Microsoft Equation to type all the equations.
3. Maximum of 4 students per group.
4. Zero mark for any plagiarism activity.