--%>

Most efficient production technique of given problem

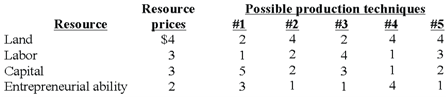
Refer to the given data give the answer of following question. In view of the indicated resource prices, the economically most efficient production technique(s) is (are) technique(s): A) #1. B) #2 and #4. C) #3. D) #1 and #3.

478_91.png

Help me to get through this problem

   Related Questions in Microeconomics

  • Q : Problem on free market economy A) Using

    A) Using appropriate tables and diagrams explain how price and quantity is determined in a free market economy. B) Briefly explain using the diagrams in 4.1 the followings two scenarios C) When

  • Q : Economic profit generating purely

    In this illustrated figure in below the only purely competitive firm currently generating economic profit is in: (w) Firm A. (x) Firm B. (y) Firm C. (z) Firm D.

    Q : Imposition of rent controls under

    The imposition of rent controls below equilibrium rental rates tends to create: (i) a housing surplus. (ii) booms of new apartment construction. (iii) declines in the quantity and upkeep of rental units. (iv) rising incomes for landlords. (v) enhanced

  • Q : Marginal Resource Costs problem Can

    Can someone please help me in finding out the accurate answer from the following question. The synonymous words of marginal factor costs or marginal resource costs signify to the: (i) Cost incurred in generating an extra unit of capital. (ii) Cost to the resource owne

  • Q : Excess demand in macro economics What

    What is meant by Excess demand in macro economics: In macro economics, if aggregate demand is greater than aggregate supply at full employment level, then there is excess demand.

  • Q : Examples of adverse selection Which of

    Which of the given below statement is not an illustration of the adverse selection? (i) You agree on a price for utilized car; however the dealer did not tell you it requires a new clutch. (ii) You send in money to a mail order company, however do not

  • Q : Discrimination In the above diagram,

    In the above diagram, the elimination of discrimination is best represented by:

  • Q : Higher income elastic demand for

    For environmental quality the demand is income elastic for most people, that implies that prosperity and higher incomes tend to: (w) increase people’s concerns about air, water, and noise pollution. (x) reduce efforts to solve pollution problems

  • Q : Demonstrates the Lorenz Curve This

    This given figure demonstrates as: (w) Lorenz curve. (x) familial income distribution graph. (y) Gini curve. (z) Blanc income standard curve. </span></p>
                                        </div>
                                        <!-- /comment-box -->
                                    </li>
   
   </td>
	</tr><tr>
		<td>
       
      <li>
                                        <div class=

    Q : Effects of price rise on Substitution

    Can someone help me in finding out the right answer from the given options. The Substitution away from the good is bigger when its price increases the: (1) More close substitutes there are for good. (2) More different utilizations to which the good has been place at t