--%>

Minimum possible economic losses

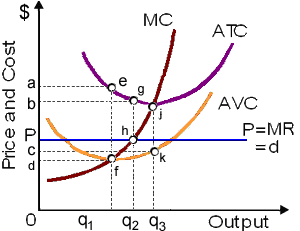
Hello guys I want your advice. Please recommend some views for below illustrated figure of Economics problem that for this profit-maximizing pure competitor, area Pbgh signifies: (1) fixed cost (TFC). (2) average fixed cost (AFC). (3) losses, but the minimum possible economic losses. (4) maximum positive economic profits. (5) rate of return on investment.

2028_profit-maximizing.png

Can anybody suggest me the proper explanation for given problem regarding Economics generally?

   Related Questions in Microeconomics

  • Q : Changes in Household Demand The changes

    The changes in a household’s tastes most directly influence the families: (1) Number of members. (2) Demands for goods. (3) Total wealth. (4) Income constraint. Can someone please help me in finding out the a

  • Q : Competitive advertising as waste of

    Economists have conventionally concluded which, from the vantage point of society as an entire, competitive advertising in that case: (1) enables consumers to make more efficient economic choices. (2) is a waste of resources. (3) cons

  • Q : An increase in consumer desire for

    An increase in consumer desire for strawberries is most likely to: increase the number of strawberry pickers needed by farmers. reduce the supply of strawberries. reduce the number of people willing to pick strawberries. reduce the need for strawberry pickers

  • Q : Increased market demand for generic 2×4s

    Increased market demand for generic 2×4s as in demonstrated graph would result within a(n) ___________ within the price of 2×4s as well as a(n) ___________ into this lumber mill’s profit-maximizing output.: (w) increase; decrease. (x

  • Q : Price discriminate by monopoly firms

    Monopoly firms which can’t price discriminate: (a) are generally forced to shut down into the long run. (b) find this impossible to bar entry by new competitors within the long run. (c) by producing maximize profit where average

  • Q : Long run supply Illustrate and explain

    Illustrate and explain using diagrams, the difference between long run supply in a constant cost individual firm and industry and an increasing cost firm and industry.

  • Q : Resource of supply curve The resource

    The resource probably to conform to the supply curve demonstrated in this figure would be: (1) housing. (2) capital. (3) labor. (4) land. (5) entrepreneurship.

    Q : Coefficient of elasticity of relatively

    Please help me to solve the problem that is given below: A relatively price elastic demand curve would consist of a coefficient of elasticity of as: (w) ep = 1. (x) ep > 1. (y) ep < 1. (z) ep

  • Q : How is TVC derived from MC How is TVC

    How is TVC derived from MC? Answer: TVC = Sigma MC

  • Q : Calculate price elasticity of demand

    Paradise Planners sold deluxe Hawaiian winter vacation’s 170 packages at a price of $1900, although only 130 tourists signed up while the price increased to $2100. Such Hawaiian vacations have a price elasticity of demand approximately equal to: