--%>

Maximizes profits of firm in a perfectly competitive market

Refer to below figure. What is the amount of profit when the firm generates Q2units: w) this is equal to the vertical distance c to g. x) this is equal to the vertical distance c to Q2. y)  this is equal to the vertical distance g to Q2. z) this is equal to the vertical distance c to g multiplied with Q2units.

275_Maximizes profits of firm in a perfectly competitive market.png

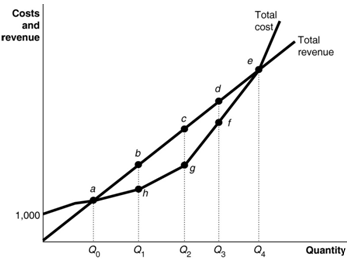
Choose one option for the query by using the above shown figure.

   Related Questions in Managerial Economics

  • Q : Example of an investment in human

    A government-supported literacy program provided from a firm which primarily employs unskilled labor is an illustration of an investment in: (1) human capital depreciation. (2) business paternalism. (3) specific training. (4) laissez-faire economics.

  • Q : What are the types of price

    What are the types of price discrimination?

  • Q : Illustrates the steps in formulating

    Illustrates the steps in formulating pricing policies in details?

  • Q : Elasticity of demand for labor and type

    The relationship between the elasticity of demand for labor and the elasticity of demand for a specific type of output the labor produces is: (1) uniformly negative. (2) uniformly positive. (3) zero. (4) curvilinear. (5) highly variab

  • Q : Illustrates definition and meaning of

    Illustrates the definition and meaning of managerial economics?

  • Q : Phases of business cycle explain the

    explain the different phases of business cycle

  • Q : Screening job hiring decisions The

    The concept that employers artificially utilize formal training and education while screening job applicants to make hiring decisions is termed as: (w) nepotism. (x) formalism. (y) human capital discrimination. (z) credentialism.

    Q : Average rate of return in Human Capital

    This illustrated graph indicates that, there on average, rate of return to education is greatest for finishing the previous year of: (1) kindergarten, at point a. (2) grade school, at point b. (3) high school, at point c. (4) undergraduate college, at

  • Q : Demand for labor between two points in

    The arc elasticity of Plastibristle’s demand for labor between point a and point b is: (1) 0.375. (2) 0.667. (3) 0.833. (4) 1.200 (5) 2.000.

    Q : Supply of Labor The firm in this

    The firm in this illustrated graph is clearly: (1) price taker in the sale of its output because of the shapes of the VMP and MRP curves. (2) price taker in the purchase of labor when this can hire as several workers as this chooses at roughly of $13 per hour. (3) mon