--%>

Maximizes profit by producing at total profit or loss

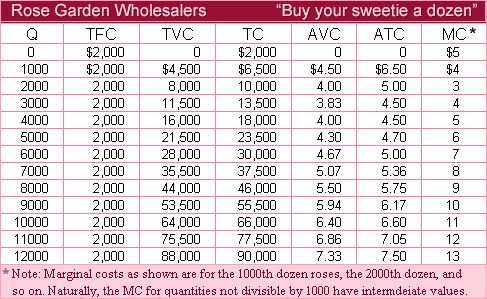
When the wholesale price P = $4 per dozen roses, it purely competitive increased farm maximizes profit through producing ___ dozen roses at a total (profit /loss) of $___. (1) zero; loss; $2000. (2) 2000; loss; $1500. (3) 3000;profit; $1500. (4) 4000; profit; $4,500. (5) 4000; profit; $2,000.

676_Profits and Losses.png

How can I solve my Economics problem? Please suggest me the correct answer.

   Related Questions in Microeconomics

  • Q : Central problems of an economy

    Elucidate the central problems of an economy: A) What to produce? B) How to produce? C) For whom to produce? Answer:

    Q : Definition of Economic Profit To assert

    To assert that a firm made exactly zero economic profits as well signifies that it made: (i) Zero accounting profits. (ii) Normal economic profits. (iii) Negative accounting profits. (iv) No profits at all. Choose the right answer

  • Q : Please In the quintile distribution of

    In the quintile distribution of income, the term "quintile" represents: A 5 percent of the income receivers. B 10 percent of the income receivers. C 15 percent of the income receivers. D 20 percent of the income receivers.

  • Q : Purely-competitive market demand For

    For the purely-competitive cranberry market, as in below figure there Curve H is: (i) industry’s long-run supply curve. (ii) firm’s demand curve in the short run. (iii) industry’s marginal cost curve. (iv) firm’s long run margi

  • Q : Shifting demand of labor The demand for

    The demand for labor will shift because of changes in all of the given except: (w) prices of other resources. (x) prices of output. (y) MPP (z) wages. Hello guys I want your advice. Please recommend some views for

  • Q : Burden of tax reduce on suppliers of

    Most of the burden of an excise (i.e., per unit) tax would be borne through consumers of the taxed good, although some of the tax burden would reduce on suppliers of the good demonstrated in: (w) Panel A. (x) Panel B. (y) Panel C. (z)

  • Q : Determine the yearly total revenues

    When the U.S. wheat market as in below demonstrated graph is primarily within equilibrium on S0D0, in that case the yearly total revenues (price × quantity) of wheat farmers will equivalent: (1) 0P4gQ4

  • Q : Average Product and Marginal Product

    State the relationship among Average Product and Marginal Product? A) If MP > AP, then AP is rising B) If MP = AP, then AP is maximum C) If MP < AP, then AP is falling

  • Q : Demand curve The law of demand is

    The law of demand is graphically demonstrated by:

  • Q : Quantity demanded in Substitution

    I have a problem in economics on Quantity demanded in Substitution process. Please help me in the following question. The sales growth resultant from price cuts for a good reflects rises in: (i) Quantity demanded. (ii) Demand. (iii) Quantity supplied.