--%>

Maximized profit of purely-competitive lumber mill

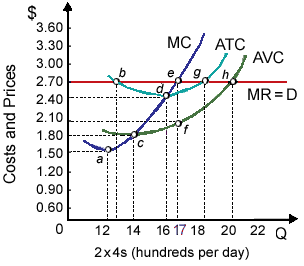
Profit is maximized as in illustrated graph when this purely-competitive lumber mill produces at: (1) point a. (2) point b. (3) point c. (4) point d. (5) point e.

1784_Profit Maximization.png

Hello guys I want your advice. Please recommend some views for above Economics problems.

   Related Questions in Microeconomics

  • Q : Problem on least monopsony power The

    The Firms which have at least some monopsony power will never: (i) Practice wage discrimination. (ii) Find out wage rates in portion by the number of workers it hires. (iii) Pay higher wages than would a firm hiring from the competitive labor market. (iv) Raise the em

  • Q : Difference between planned and actual

    Differentiate between planned and actual saving and investment. Answer: There is a big difference between (a) planned S and I and (b) Actual saving and investment.<

  • Q : Price elastic of supply between two

    In between point c and d in this supply curve of 2×4s, the price elastic of supply as: (i) 1.0. (ii) 1.6. (iii) 2.2. (iv) 2.8. (v) 3.4.

    Q : Capital or current account Is import of

    Is import of machinery recorded in capital or current account? Answer: It is recorded in current account since it deals as the purchase of goods.

  • Q : Monopsony how do you determine

    how do you determine equilibrium for nurses in a monopsony

  • Q : Charting of past prices Can the

    Can the charting of past prices be used to predict future prices?

  • Q : Monopolistic competitive firm in normal

    This monopolistically competitive firm in illustrated figure produces Q units as well as experiences: (1) economic profits equal to 0cbQ. (2) economic losses equal to cpab. (3) more than normal accounting profits. (4) marginal cost in excess of averag

  • Q : Perfectly price elasticity of supply

    The supply of textile employees in China is possibly most like the perfectly price elastic supply curve within: (w) Panel A. (x) Panel B. (y) Panel C. (z) Panel D.

    Q : Break-even level of income under

    For a family of four the break-even level of income under the negative income tax system demonstrated in this figure is: (1) $15,000 per year. (2) $30,000 per year. (3) $45,000 per year. (4) $60,000 per year. (5) $75,000 per year.

  • Q : Average variable cost curve of firm Can

    Can someone specify correct answer of the given query of demonstrated figure in below that curve J is that cranberry of: (w) industry’s supply curve. (x) firm’s demand curve. (y) firm’s average variable cost curve. (z) firm’s short-run supply c