--%>

Market shift when exporting

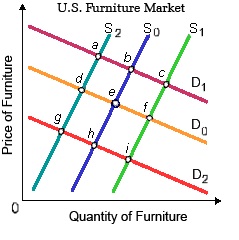
When the U.S. furniture market is primarily in equilibrium at point e on S0D0 and then Chinese manufacturers start exporting more furniture to the United States, then this market would shift towards a new equilibrium at: (1) point a. (2) point b. (3) point c. (4) point d. (5) point f.

884_5.jpg

Can someone help me in getting through this problem.

   Related Questions in Macroeconomics

  • Q : Surplus of the good Describe when there

    Describe when there will be a surplus of the good?

  • Q : Limitation of credit availability What

    What occurs to economy, when credit availability is limited and credit is made costlier? Answer: Aggregate demands falls

  • Q : Value of imports of goods The country’s

    The country’s balance of trade is Rs.500 crores. The value of exports of goods is Rs. 650 crores. What is the value of imports of goods?

  • Q : Monetary policy-how is it decided The

    The practice explores how monetary policy influences the economy and the type of factors which are significant in finding out the Monetary Policy Committee’s decision.

  • Q : Fox I don't know how to make him stop

    I don't know how to make him stop dancing

  • Q : Analyzing number of event that

    How can we analyze the number of event that influences the market?

  • Q : Components of aggregate demand What are

    What are the components of aggregate demand (AD)? Answer: The components of AD are as follows:AD = C + I + G + (X - M) By Simplifying AD = C + I, Here C refers to Household consumption demand and I refer

  • Q : Shifting of market problem When this

    When this market starts in equilibrium at point e on S0D0 and then young American families rousingly “inherit” furniture as their baby-boomer parents shift into smaller retirement homes, then this market will tend to shift in the direction of: (i) point i.

  • Q : Demand according to range of adjustments

    As longer time periods are taken and a bigger range of adjustments (or substitutions) become obtainable, then demand curves tend to become: (1) flatter, as supply curves become steeper. (2) Steeper as supply curves become flatter. (3) Flatter, and therefore do supply

  • Q : Problem on tax system In the figure

    In the figure shown below, line T0 depicts a tax system which is: (1) Progressive. (2) Regressive. (3) Proportional. (4) Unbiased. (5) Recessive. 386</span></p>
                                        </div>
                                        <!-- /comment-box -->
                                    </li>
   
   </td>
	</tr>
</table>


                                </ul>
                                <!-- /user-comments-list -->
                            </div>
                        </div>
                    <div  class=

    Discover Q & A

    Leading Solution Library
    Avail More Than 1440784 Solved problems, classrooms assignments, textbook's solutions, for quick Downloads
    No hassle, Instant Access
    Start Discovering

    18,76,764

    1950615
    Asked

    3,689

    Active Tutors

    1440784

    Questions
    Answered

    Start Excelling in your courses, Ask an Expert and get answers for your homework and assignments!!

    Submit Assignment

    ©TutorsGlobe All rights reserved 2022-2023.