Market-period supply curve
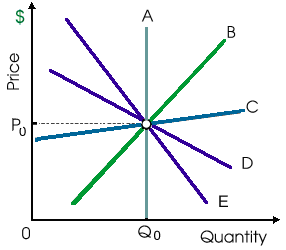
For a purely competitive industry a market-period supply curve would be: (i) curve A. (ii) curve B. (iii) curve C. (iv) curve D. (v) curve E. Hello guys I want your advice. Please recommend some views for above Economics problems.
For a purely competitive industry a market-period supply curve would be: (i) curve A. (ii) curve B. (iii) curve C. (iv) curve D. (v) curve E.
Hello guys I want your advice. Please recommend some views for above Economics problems.
Oligopolies cannot: (w) maximize where MR = MC. (x) differentiate their product. (y) act independently of other firms. (z) make economic profits within the long run. Can someone explain/help me with best solution a
Can someone help me in finding out the right answer from the given options. The employer who amplifies the safety of a place or prospects for advancement to the job applicants makes inefficiencies (or arguable inequities) since of: (1) Signaling. (2) Credentialism. (3
Inferior good: It is a good for which, other things equivalent, a rise in income leads to a reduction in demand.
The law of demand defines that there is a negative relationship among: (1) A good’s price and quantity demanded. (2) Limitless demands and inadequate resources. (3) The quantities demanded and supplied. (4) People’s income and demands for
After Babble-On’s patents lapsed and entry and exit turned into possible in this illustrated figure of market, in the long run Babble-On would be expected to: (i) continue to reap economic profits. (ii) break even and experience zero economic pr
Assume that all such curves in below demonstrated graph are infinitely long straight lines. The supply curve which is perfectly price-elastic is: (1) supply curve S1. (2) supply curve S2. (3) supply curve S3. (4) suppl
When cranberry farming is an increasing constant cost industry and that firm is typical, in that case an increase within the market demand for cranberries will give in a long run equilibrium price as: (i) less than P1. (ii) greater than P2.
A price increase for Pixie’s cheesy fried grits by P1 to P2 would yield higher total as: (w) revenue because demand is price elastic. (x) supply since demand is unitarily elastic. (y) revenue since demand is price inelastic. (z) use of the
Characteristics of industries which are not characteristics internal to operations of an individual firm include: (1) potential principal-agent problems. (2) diseconomies of scale. (3) production costs which either increase or decrease like the size of a market not su
Why demand curve is more elastic under monopolistic competition as compare to monopoly.
18,76,764
1922760 Asked
3,689
Active Tutors
1416263
Questions Answered
Start Excelling in your courses, Ask an Expert and get answers for your homework and assignments!!