Market experiencing a rise in demand problem
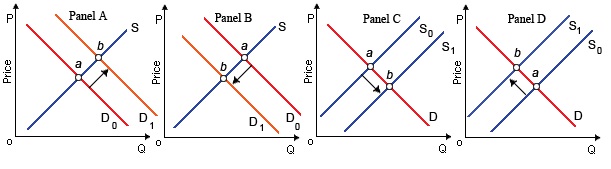
When equilibrium moves from point a to point b in the figure shown below, the only market experiencing a rise in demand is illustrated in: (1) Panel A. (2) Panel B. (3) Panel C. (4) Panel D. Can someone help me in getting through this problem.
When equilibrium moves from point a to point b in the figure shown below, the only market experiencing a rise in demand is illustrated in: (1) Panel A. (2) Panel B. (3) Panel C. (4) Panel D.
Can someone help me in getting through this problem.
Land, capital and labor are all scarce since: (1) advertising mainly over stimulates human wants. (2) once employed they cannot be used again. (3) each productive resource needs a monetary return for its employ. (4) inheritance under a capitalism prot
Government tax and transfer payments generally
Explain evaluation of net present value (NPV) and internal rate of return (IRR) in brief?
Whenever you dine at an “all-you-can-eat” buffet, the rational consumption prototype is to carry on eating till: (1) The restaurant goes bankrupt. (2) You have eaten as much food as it would encompass cost had you made your own meal at hom
If the MPC is .70 and investment increases by $3 billion, the equilibrium GDP will:
use two market diagrams to explain how an increase in state subsidies to public colleges might affect tuition and enrollments in both public and private colleges?
Quetion: Describe the present economic crisis situation in Europe. Why has it been so difficult for the Europeans to find a solution to this problem? Comment on what implications the crisis may have for the rest of the
What is "demand-pull" inflation?
What are the strength and weakness of using per capital national income? give explained answer for query
How does a commercial bank make money? Answer: Commercial banks are capable to make credit that is many times greater than deposits received by banks. Money creatio
18,76,764
1924367 Asked
3,689
Active Tutors
1445150
Questions Answered
Start Excelling in your courses, Ask an Expert and get answers for your homework and assignments!!