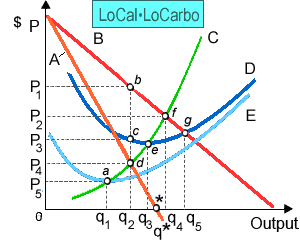
LoCalLoCarbo has turn into the favorite of fad dieters. There in illustrated graph curve B shows: (i) LoCalLoCarbo’s marginal cost curve. (ii) LoCalLoCarbo’s average variable cost curve. (iii) LoCalLoCarbo’s average total cost curve. (iv) the market demand curve facing LoCalLoCarbo. (v) LoCalLoCarbo’s marginal revenue curve.

Can anybody suggest me the proper explanation for given problem regarding Economics generally?