--%>

Market demand curve

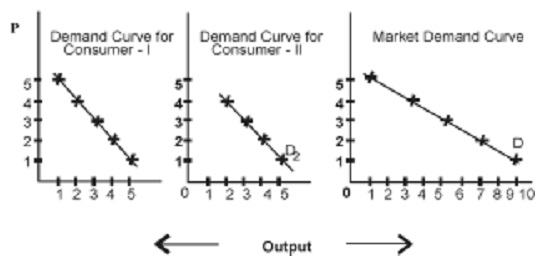
Market demand curve:

The market demand also rises with a fall in price and vice-versa.

In figure below the quantity demanded by consumer I and consumer II are measured on horizontal axis and the market price is computed on the vertical axis. The net demand of these two consumers that is, D1 + D2 = DDM - DDM – the market demand curve - as well slopes downwards just similar to the individual demand curve. Similar to normal demand curve, it is convex to the origin. It reveals the inverse relationship.

17_market demnad curve.jpg

   Related Questions in Microeconomics

  • Q : Present Value of an Annual Income The

    The present value of an annual income stream which goes on forever equals the annual income as: (w) times infinity. (x) divided by the wage rate. (y) multiplied by the interest rate. (z) divided by the interest rate.

    Q : Wage Rates and Marginal Resource Costs

    Can someone please help me in finding out the accurate answer from the following question. When a firm is the price taker in labor market and the salary is $80 per day, then the marginal resource cost incurred if hiring 20 more workers per day is as: (i) $1600. (ii) $

  • Q : The Debate about Welfare Programs

    Debate over U.S. welfare programs doesn’t focus onto: (w) choices in amounts and types of subsidies for health care. (x) repealing the negative income tax. (y) impacts on efficiency and incentives. (z) social conflicts over redistribution of inc

  • Q : Shifting of Complementary Goods towards

    The War in Iraq contributed to sharp rises in the world price of oil. This is most probable to encompass caused the demand for car washes in United States to: (1) Shift towards right. (2) Increase vertically. (3) Stabilize. (4) Shift towards left. (5) Much more inform

  • Q : Types of elasticity of supply Types of

    Types of elasticity of supply: There are five kinds of elasticity of supply:1. Perfectly elastic supply:

    Q : Problem based on GDP Assume nominal GDP

    Assume nominal GDP in the year of 2002 was $100 billion and in the year of 2003 it was $260 billion. The general price index in 2002 was 100 and in 2003 it was 180. Between 2002 and 2003 the real GDP rose by: A) 160 percent. B) 44 percent. C) 37 percent. D) 1

  • Q : What will be included in illustrations

    Illustrations of price floors comprised: (1) agricultural subsidies upon, for example: corn. (2) usury laws, that are limits on the interest rates on loans. (3) utility rate structures upon natural gas or electricity. (4) rent controls in London, San

  • Q : Variation in demand curve with price

    The demand curve along with price elasticity which definitely varies along the curve is within: (w) Panel A. (x) Panel B. (y) Panel C. (z) Panel D.

    Q : Prices of resources in constant cost

    When industry expansion or contraction does not influence the prices of resources used through its firms, then the industry tends to experience: (w) increasing costs. (x) constant costs. (y) decreasing costs. (z) diseconomies of scale.

    Q : Effects of price ceiling Effects of

    Effects of price ceiling: The consequences of price ceiling might be: A) Scarcity of the commodity B) The government might oblige rationing that is, supply of goods in limited q