--%>

Marginal Revenue and Costs in purely competitive firm

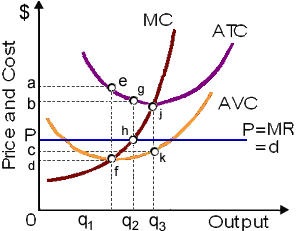
Hey friends I need your suggestion for this query about the profit and losses as illustrated graph when this firm produces q2 output, in that case its: (w) MR > MC. (x) MR < MC. (y) MR = MC. (z) P > MC.
Please give me right answer for the same.

2323_profit-maximizing.png

Can someone explain/help me with best solution about problem of Economics...

   Related Questions in Microeconomics

  • Q : Who made decisions Economists suppose

    Economists suppose that nearly all decisions are made by: (i) At the margin. (ii) On the average. (iii) Based on totals. (iv) All of the above. Please someone suggest me the right answer.

  • Q : Marginal revenue curve with marginal

    LoCalLoCarbo has turn into the favorite of fad dieters. There in demonstrated figure curve A shows: (i) LoCalLoCarbo’s marginal cost curve. (ii) LoCalLoCarbo’s average variable cost curve. (iii) LoCalLoCarbo’s average total cost curve. (iv) the marke

  • Q : Compare firms with substantial market

    Compared to Firms A and B as well as C, Firm D is: (1) a firm along with substantial market power. (2) a pure price taker and quantity adjuster. (3) least possible to generate economic profit in the long run. (4) a total revenue maximizer when it produces output level

  • Q : Influence of drought in market price

    Severe drought outcomes in a drastic fall in the output of wheat. Examine how will it influence the market price of wheat? Answer: As an outcome of severe drought,

  • Q : Illustration of Substitution Effect

    Sally is very rich that money hardly matters to her, although when the price of JIF chunky peanut butter doubled Sally switched to Peter Pan chunky peanut butter. This alters is an example of the: (1) Income effect. (2) Payback effect. (3) Substitution effect. (4) Pri

  • Q : Excess supply at the minimum price

    Programs which guarantee farmers minimum prices which exceed equilibrium prices will yield: (w) cheaper food for consumers. (x) excess demand in food markets. (y) excess supply at the minimum price. (z) higher equilibrium prices.

  • Q : Goods and services Refer to the above

    Refer to the above data. Choose the right answer from following. Zabella's balance on goods and services illustrates a: A) $5 billion deficit. B) $5 billion surplus. C) $10 billion surplus. D) $15 billion deficit.

    Q : Problem relating to Changes in Demand

    Airlines considerably decreased the number of flights accessible in the year 2005, as compared to flight availability during the year 2000. Passenger mileage was fall. Economists would be least possible to ascribe the decline in airline ticket sales throughout the ear

  • Q : Generates price-quantity consistent for

    All prospective demanders [buyers] would be within equilibrium when this market for teleporter buttons created a price and a quantity consistent along with: (1) eliminating the shortage Q1-Q3 existing at P3<

  • Q : Income tax rates and government

    When line 0C0' in this figure shows the current Lorenz curve for the U.S. distribution of income after taxes and transfers, the probably short run outcomes of 10 percent cuts into both income tax rates and government transfer