--%>

Long run equilibrium price

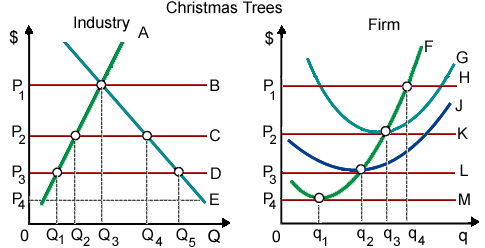
When Christmas tree farming is a decreasing cost industry and this firm is typical, in that case an increase in the market demand for Christmas trees will give in a long run equilibrium price: (1) greater than P1. (2) less than P2. (3) more than P3 but less than P2. (4) more than P4 but more than P3. (5) less than P4.

101_supply and demand1.png

Hello guys I want your advice. Please recommend some views for above Economics problems.

   Related Questions in Microeconomics

  • Q : Explain an example of price

    A Ferris wheel operator at the county fair charges of $2 per ride. Individual seat is vacant on what will be the final ride of the day. He asks when you would like a ride for a dollar. It is an illustration of: (1) reservation pricing. (2) price discrimination. (3) as

  • Q : Freedom to enter or leave the market in

    Purely competitive industries are not described by: (i) numerous potential buyers. (ii) product homogeneity. (iii) numerous potential sellers. (iv) freedom to enter or leave the market within the short run. (v) power to adjust quantities although no p

  • Q : Technological advances in natural

    Natural barriers to entry may be overcome across time from: (w) cut-throat competition. (x) elimination of patent laws. (y) technological advances. (z) rigorous enforcement of antitrust laws. How can I solve my

  • Q : Horizontal sum of the quantities in

    The short-run supply curve for a purely competitive industry is the horizontal total of the: (a) quantities demanded by consumers at each price. (b) prices charged by individual firms for each quantity supplied. (c) quantities supplied by established

  • Q : Industry demand curve for monopoly and

    HoloIMAGine has patented a holographic technology which makes 3-D photography obtainable to consumers. When HoloIMAGine is a pure monopoly, in that case this firm confronts a demand curve which is: (w) identical to the industry demand

  • Q : Problem on free market economy A) Using

    A) Using appropriate tables and diagrams explain how price and quantity is determined in a free market economy. B) Briefly explain using the diagrams in 4.1 the followings two scenarios C) When

  • Q : Quantity of good demanded A Rise in the

    A Rise in the quantity of frozen vegetarian lasagna demanded would be much probable to outcome from raises in the: (i) Cost of raw vegetables. (ii) Wages paid workers in lasagna developed plants. (iii) Number of people who perform strict vegetarianism. (iv) Costs of o

  • Q : Isoquants and isocost lines By using

    By using isoquants and isocost lines, illustrates graphically that rise in y will result in a decline in the quantity demanded of x1 and also illustrates that rise in the price of x1 will result in a reduction in the quantity demanded of x1<

  • Q : Differentiate perfect and monopoly

    Differentiate between perfect competition and monopoly competition?

  • Q : Determine the yearly total revenues

    When the U.S. wheat market as in below demonstrated graph is primarily within equilibrium on S0D0, in that case the yearly total revenues (price × quantity) of wheat farmers will equivalent: (1) 0P4gQ4