Least consistency for law of demand

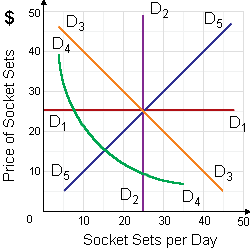
The demand curve for socket sets from the list below which is least consistent along with the law of demand is: (w) demand curve D1D1. (x) demand curve D2D2.  (y) demand curve D3D3. (z) demand curve D4D4.

888_Price Elasticity of Demand.png

How can I solve my economics problem? Please suggest me the correct answer.

   Related Questions in Microeconomics

  • Q : Problem on Yellow Dog Contracts Now the

    Now the illegal labor market practice of signing the yellow dog contracts includes requiring: (1) Nonunion workers to pay the union dues as the condition of employment. (2) Job applicants to sign the agreements not to join unions previous to hiring them. (3) Unions to

  • Q : Purely competitive market at

    For a purely competitive market at any equilibrium point on the short-run supply curve: (w) all firms have identical marginal costs. (x) economic profit is positive. (y) accounting profit is normal. (z) marginal revenue = average cost.

    Q : LEAST Liquidity in market The LEAST

    The LEAST liquid of the given assets is: (1) a corporation's capital. (2) savings accounts. (3) cash. (4) U.S. savings bonds. (5) checking accounts. Hey friends please give your opinion for the problem of E

  • Q : Shutdown point in minimum revenue for

    The minimum revenue which will induce a firm to produce a specified output in place of shutting down into the short run is the: (a) maximum such consumers are willing to pay for that output. (b) total variable cost of producing such output. (c) short-

  • Q : Change in the price of a resource A

    A change in the price of a resource will cause a modification in the: (w) demand for the resource. (x) supply of the resource. (y) quantity demanded of the resource. (z) demand for the good the resource produces. H

  • Q : Marginal tax rate under negative income

    The marginal tax rate upon earned income under negative income tax system demonstrated in this figure is: (1) 15 percent. (2) 20 percent. (3) 25 percent. (4) 33.3 percent. (5) 50 percent.

    Q : Charting of past prices Can the

    Can the charting of past prices be used to predict future prices?

  • Q : Area of Loren Curve This function as in

    This function as in illustrated figure area between A and B is termed as a/an: (1) index of inequality. (2) Lorenz curve. (3) Pareto indicator. (4) Gini coefficient. (5) Marx-Engels curve.

    Q : Definitions of Poverty The official

    The official United States “poverty line” is based upon the cost of securing the goods essential to maintain a standard of living: (w) at a middle class level of comfort. (x) one standard deviation below the national average. (y) that is m

  • Q : Determine elasticity of demand for

    When the U.S. price elasticity of demand for gasoline is 1.0, the price elasticity of demand for gas sold through one of several gas stations along a busy highway: (w) less than 1.0. (x) 1.0. (y) greater than 1.0. (z) zero.

    Discover Q & A

    Leading Solution Library
    Avail More Than 1444441 Solved problems, classrooms assignments, textbook's solutions, for quick Downloads
    No hassle, Instant Access
    Start Discovering

    18,76,764

    1956741
    Asked

    3,689

    Active Tutors

    1444441

    Questions
    Answered

    Start Excelling in your courses, Ask an Expert and get answers for your homework and assignments!!

    Submit Assignment

    ©TutorsGlobe All rights reserved 2022-2023.